Practice Essentials
Stroke, or cerebrovascular accident (CVA), is a clinical term that describes a sudden loss of neurologic function persisting for more than 24 hours that is caused by an interruption of the blood supply to the brain (see the images below). Stroke is the third leading cause of death worldwide, with considerable disability among survivors. [1, 2]
The etiologies of stroke are varied but can broadly be categorized into ischemic or hemorrhagic infarctions. Approximately 80-87% of strokes are from ischemic infarction due to thrombotic or embolic cerebrovascular occlusion. Hemorrhagic infarctions constitute most of the remainder of strokes, with a smaller number due to aneurysmal subarachnoid hemorrhage. [1, 3, 4, 5]
Furthermore, 20-40% of patients with ischemic infarction may develop hemorrhagic transformation within one week after ictus. [6, 7] Differentiating between these different types of stroke is an essential part of the initial workup of these patients because the subsequent management of each patient is vastly different. The scope of this article mainly focuses on ischemic and hemorrhagic stroke.
Neuroimaging plays a vital role in the workup of acute stroke by providing information essential to accurately triage patients, expedite clinical decision making with regard to treatment, and improve outcomes in patients presenting with acute stroke. Rapid and accurate diagnosis is crucial. [8] CT allows time-critical decision-making in stroke patients, informing decisions on thrombolytic therapy with tPA, which has a narrow therapeutic index. [9]
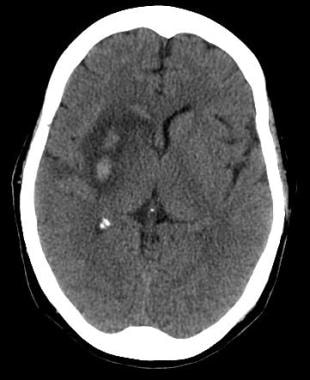
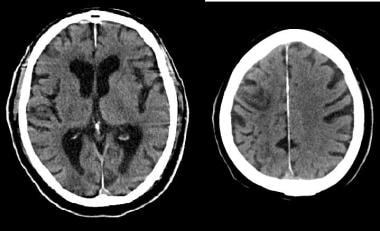
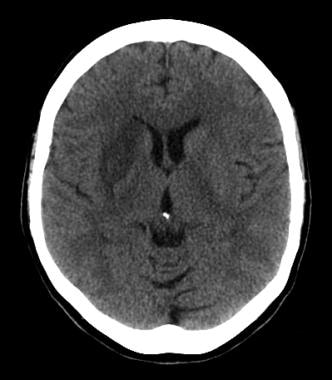 Axial noncontrast computed tomography (NCCT) demonstrates diffuse hypodensity in the right lentiform nucleus, with mass effect upon the frontal horn of the right lateral ventricle. The patient is a 70-year-old female with history of left-sided weakness for several hours duration.
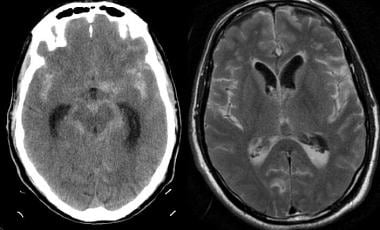
 MRI was subsequently obtained in the same patient. An axial T2 FLAIR image (left) demonstrates high signal in the lentiform nucleus with mass effect. The axial diffusion-weighted image (middle) demonstrates high signal in the same area with corresponding low signal on the apparent diffusion coefficient (ADC) maps, consistent with true restricted diffusion and an acute infarction. Maximum intensity projection from a 3D time-of-flight MRA (right) demonstrates occlusion of the distal middle cerebral artery (MCA) trunk (red circle).
Pathophysiology
Ischemic stroke
Acute ischemic strokes are the result of vascular occlusion secondary to thromboembolic disease. Ischemia results in cell hypoxia and depletion of cellular adenosine triphosphate (ATP). Without ATP, energy failure results in an inability to maintain ionic gradients across the cell membrane and cell depolarization. Influx of sodium and calcium ions and passive inflow of water into the cell ensues, resulting in cytotoxic edema. Further, cell depolarization leads to the release of glutamate and free radicals, mitochondrial membrane disruption, and a cascade that ultimately leads to apoptotic cell death. [5, 10]
Ischemia also directly results in dysfunction of the cerebral vasculature, with breakdown of the blood-brain barrier occurring within 4-6 hours after infarction. Following breakdown of the blood-brain barrier, proteins and water flood into the extracellular space, leading to vasogenic edema. Vasogenic edema produces greater levels of brain swelling and mass effect that peak at 3-5 days and resolves over the next several weeks with resorption of water and proteins. [11, 12]
Infarction results in the death of astrocytes as well as the supporting oligodendroglia and microglia cells. The infarcted tissue eventually undergoes liquefaction necrosis and is removed by macrophages with the development of parenchymal volume loss. A well-circumscribed region of cerebrospinal-fluidlike low density is eventually seen, consisting of encephalomalacia and cystic change. The evolution of these chronic changes may be seen in the weeks to months following the infarction.
Ischemic penumbra
Ischemic tissue can be functionally divided into the irreversibly damaged infarct core and the ischemic penumbra surrounding it. The infarct core is the central zone of dead or dying tissue in an ischemic area. Surrounding the infarct core is tissue with less severe reduction in blood flow that may be salvaged with early reperfusion, termed ischemic penumbra, and oligemic tissue at the periphery. Without reperfusion, the zone of infarct core may extend to involve the penumbra. The goals of modern ischemic stroke diagnosis and therapy lie in identifying the infarct core and determining if any significant salvageable tissue exists. [13]
Ischemic stroke classification
Ischemic strokes may be divided into 3 major subtypes, based on the TOAST classification system, adopted from the system of categorizing stroke developed in the multicenter Trial of Org 10172 in Acute Stroke Treatment. These include large artery infarction, small-vessel or lacunar infarction, and cardioembolic infarctions. [14, 15]
Large vessel occlusive disease
Large artery occlusion typically results from embolization of atherosclerotic debris originating from the common or internal carotid arteries or from a cardiac source. A smaller number of large artery occlusions may arise from plaque ulceration and in situ thrombosis. Large-vessel ischemic strokes more commonly affect the middle cerebral artery territory, with the anterior cerebral artery territory affected to a lesser degree (see the images below).
 Noncontrast CT in this 52-year-old male with history of worsening right-sided weakness and apahasia demonstrates diffuse hypodensity and sulcal effacement involving the left anterior and middle cerebral artery territories consistent with acute infarction. Scattered curvilinear areas of hyperdensity are suggestive of developing petechial hemorrhage in this large area of infarction.
 MRA in the same patient (left) demonstrates occlusion of the left precavernous supraclinoid internal carotid artery (ICA, red circle), occlusion or high-grade stenosis of the distal middle cerebral artery (MCA) trunk and attenuation of multiple M2 branches. The diffusion-weighted image (right) demonstrates high signal confirmed to be true restricted diffusion on the ADC map consistent with acute infarction.
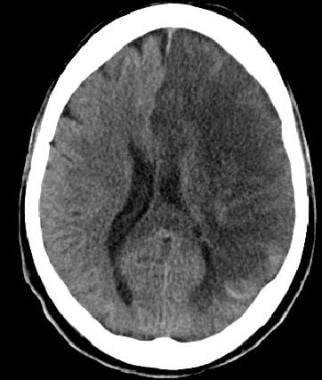
 This 60-year-old female underwent NCCT after an episode of left upper extremity weakness. NCCT demonstrates cortical and subcortical hypodensity involving the right mid to anterior temporal lobe.
 MIP image from a CTA demonstrates a filling defect or high-grade stenosis at the branching point of the right MCA trunk (red circle), suspicious for thrombus or embolus. CTA is highly accurate in detecting large vessel stenosis and occlusions, which comprise approximately one third of ischemic strokes.
Lacunar infarction
Lacunar infarctions are small infarcts resulting from occlusion of deep, penetrating end arteries (see the image below). They may be caused by small vessel atherosclerosis and lipohyalinosis related to hypertension or embolic occlusion. Because of the limited area supplied by these perforating end arteries, their obstruction results in a small area of infarction ranging from about 5 mm in diameter up to approximately 15 mm. The most common locations for lacunar infarctions include the basal ganglia, internal capsule, thalamus, and the corona radiata. [16, 17, 18]
 Axial noncontrast CT demonstrates a focal area of hypodensity in the left posterior limb of the internal capsule in this 60-year-old male with new onset of right-sided weakness. The lesion demonstrates high signal on the FLAIR sequence (middle image) and DWI (right image), with low signal on the ADC maps, indicating an acute lacunar infarction. Lacunar infarcts are typically no more than 1.5 cm in size and can occur in the deep gray matter structures, corona radiata, brainstem, and cerebellum.
Cardioembolic infarction
Cardiogenic emboli are a common source of recurrent stroke (see the image below). They may constitute up to 20% of acute stroke and have been reported to have the highest 1-month mortality. Risk factors include atrial fibrillation and recent cardiac surgery. Cardioembolic strokes may be isolated, multiple and in a single hemisphere, or scattered and bilateral; the latter two indicate multiple vascular distributions and are more specific for cardioembolism. Multiple and bilateral infarcts can be the result of embolic showers or recurrent emboli. Other possibilities for single and bilateral hemispheric infarctions include emboli originating from the aortic arch and diffuse thrombotic or inflammatory processes that can lead to multiple small vessel occlusions. [19, 20]
 Cardioembolic stroke: Axial diffusion-weighted images demonstrate scattered foci of high signal in the subcortical and deep white matter bilaterally in a patient with a known cardiac source for embolization. An area of low signal in the left gangliocapsular region may be secondary to prior hemorrhage or subacute to chronic lacunar infarct. Recurrent strokes are most commonly secondary to cardioembolic phenomenon.
Watershed infarction
Vascular watershed or border-zone infarctions occur at the most distal areas between arterial territories (see the image below). They are believed to be secondary to embolic phenomenon or due to severe hypoperfusion, such as in carotid occlusion or prolonged hypotension. [21, 22]
 MRI was obtained to evaluate this 62-year-old hypertensive and diabetic male with history of transient episodes of right-sided weakness and aphasia. The FLAIR image (left) demonstrates patchy areas of high signal arranged in a linear fashion in the deep white matter, bilaterally. This configuration is typical for deep borderzone or watershed infarction; in this case, the anterior and posterior middle cerebral artery (MCA) watershed areas. The left-sided infarcts have corresponding low signal on the ADC map (right), signifying acuity. An old left posterior parietal infarct is noted as well.
Hemorrhagic transformation of ischemic stroke
Hemorrhagic transformation represents the conversion of a bland infarction into an area of hemorrhage. Proposed mechanisms for hemorrhagic transformation include reperfusion of ischemically injured tissue, either from recanalization of an occluded vessel or from collateral blood supply to the ischemic territory or disruption of the blood brain barrier. With disruption of the blood-brain barrier, red blood cells extravasate from the weakened capillary bed, producing petechial hemorrhage or more frank intraparenchymal hematoma. [5, 23, 24]
Hemorrhagic transformation of an ischemic infarct occurs within 2-14 days post ictus, usually within the first week. It is more commonly seen following cardioembolic strokes and is more likely with larger infarct size. [5, 7, 8] Hemorrhagic transformation is also more likely following administration of tPA and with noncontrast CT demonstrating areas of hypodensity (see the image below). [13, 25, 26]
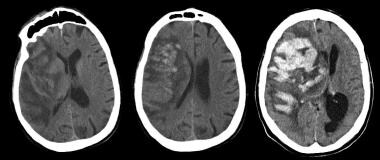 Noncontrast CT (left) obtained after this 75-year-old male was admitted for CVA; scan demonstrates a large right middle cerebral artery distribution infarction with linear areas of developing hemorrhage. These become more confluent on day 2 of hospitalization (middle image), with increased mass effect and midline shift. Massive hemorrhagic transformation occurs by day 6 (right) with increased leftward midline shift and subfalcine herniation. Obstructive hydrocephalus is also noted with dilatation of the lateral ventricles, likely due to compression of the foramen of Monroe. Intraventricular hemorrhage is also noted, layering in the left occipital horn. Larger infarctions are more likely to undergo hemorrhagic transformation and are one contraindication to thrombolytic therapy.
Hemorrhagic stroke
The most common etiology of primary hemorrhagic stroke (intracerebral hemorrhage) is hypertension, with at least two thirds of patients with primary intraparenchymal hemorrhage reported to have preexisting or newly diagnosed hypertension. Hypertensive small vessel disease results from tiny lipohyalinotic aneurysms that subsequently rupture and result in intraparenchymal hemorrhage. Typical locations include the basal ganglia, thalami, cerebellum, and pons (see the images below). The remaining cases of spontaneous intraparenchymal hemorrhage may be secondary to vascular malformations (eg, arteriovenous malformations and cavernous malformations) or amyloid angiopathy. [5, 27, 28, 23, 29]
 Axial noncontrast CT scan of the brain in a 60-year-old male with history of acute onset of left-sided weakness demonstrates 2 areas of intracerebral hemorrhage in the right lentiform nucleus with surrounding edema and effacement of the adjacent cortical sulci and right sylvian fissure. Mass effect is present upon the frontal horn of the right lateral ventricle with intraventricular extension of hemorrhage.
 Noncontrast CT of the brain (left) demonstrates an acute hemorrhage in the left gangliocapsular region with surrounding white matter hypodensity consistent with vasogenic edema. T2-weighted axial MRI (middle image) demonstrates the hemorrhage with surrounding high-signal edema. The coronal gradient echo image (right) demonstrates susceptibility related to the hematoma with markedly low signal adjacent the left caudate head. Gradient echo images are highly sensitive for blood products.
Subarachnoid hemorrhage
The most common cause of atraumatic hemorrhage into the subarachnoid space is rupture of an intracranial aneurysm. Aneurysms are focal dilatations of arteries, with the most frequently encountered intracranial type being the berry aneurysm or saccular aneurysms. Aneurysms may less commonly be related to altered hemodynamics related to arteriovenous malformations, collagen-vascular disease, polycystic kidney disease, septic emboli, and neoplasms.
Nonaneurysmal perimesencephalic subarachnoid hemorrhage may also be seen and is thought to arise from capillary or venous rupture. It has a less severe clinical course and, in general, better prognosis.
Berry aneurysms are most commonly isolated lesions that form due to a combination of hemodynamic stresses and acquired or congenital weakness in the vessel wall. Saccular aneurysms typically occur at vascular bifurcations, with more than 90% occurring in the anterior circulation. These include the junction of the anterior communication arteries and anterior cerebral arteries most commonly, the middle cerebral artery bifurcation, the supraclinoid internal carotid artery at the origin of the posterior communicating artery, and the bifurcation of the ICA.
The pathologic effects of SAH on the brain are multifocal. SAH results in elevated intracranial pressure and impairs cerebral autoregulation. This, in combination with acute vasoconstriction, microvascular platelet aggregation, and loss of microvascular perfusion, results in profound reduction in blood flow and cerebral ischemia (see the images below). [30]
 Noncontrast CT scan was performed emergently in this 71-year-old male who presented with acute onset of severe headache and underwent rapid neurologic deterioration requiring intubation. The noncontrast CT (left image) demonstrates diffuse, high-density subarachnoid hemorrhage in the basilar cisterns and both Sylvian fissures. Diffuse loss of gray-white differentiation is present. The FLAIR image demonstrates high signal throughout the cortical sulci, basilar cisterns, and in the dependent portions of the ventricles. FLAIR is highly sensitive to acute subarachnoid hemorrhage because of the suppression of high CSF signal lending to greater conspicuity of SAH compared with conventional MRI sequences.
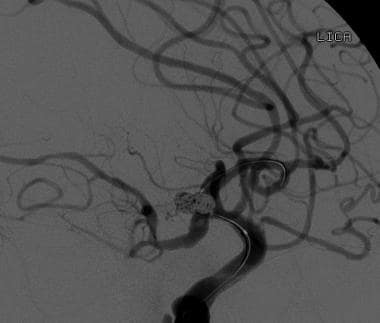
 This patient subsequently underwent a CTA and subsequent cerebral angiography. Multiple aneurysms were identified, including a 9-mm aneurysm at the junction of the anterior cerebral and posterior communicating arteries seen on this lateral view of an internal carotid artery (ICA) injection. Balloon-assisted coil embolization was performed.
 Lateral view of a selective injection of the left internal carotid artery demonstrates a microcatheter passing distal to the aneurysm neck. This lateral view from an angiogram performed during balloon-assisted coil embolization demonstrates significantly diminished filling of the aneurysm.
Mortality and Morbidity
Each year in the United States, approximately 795,000 people experience new or recurrent stroke. Of these, approximately 610,000 represent initial attacks, and 185,000 represent recurrent strokes. The incidence of stroke varies depending on age, gender, ethnicity, and socioeconomic status. Approximately 87% of strokes in the United States are ischemic, 10% are secondary to intracerebral hemorrhage, and another 3% may be secondary to subarachnoid hemorrhage. [1]
The global incidence of stroke has at least modest variation from nation to nation, suggesting the importance of genetics and environmental factors, such as disparities in access to healthcare for developing countries. According to the World Health Organization, 15 million people suffer stroke worldwide each year. The age-adjusted incidence of total strokes per 1000 person-years for people 55 years or older has been reported in the range of 4.2–6.5. The highest incidences have been reported in Russia, Ukraine, and Japan.
The increased survival among stroke victims places an increased demand on healthcare systems globally. [5, 31]
Stroke subtypes also vary greatly in different parts of the world. For example, the proportion of hemorrhagic strokes may be even higher in certain populations, such as in China, which was reported to be up to 39.4%, and up to 38.7% in Japan. [31, 32]
Stroke is the second leading cause of death and the third leading cause of disability in the world. In 2010, there were 16.9 million incident stroke cases, 33.0 million prevalent stroke cases, and 5.9 million deaths attributed to stroke. According to a report from the American Heart Association, approximately 87% of all strokes were ischemic strokes. Stroke accounts for approximately 9% of deaths around the world. The mortality approaches 50-100 deaths per 100,000 people per year worldwide but varies significantly regionally. Mortality is highest in many developing nations, likely due to genetic and socioeconomic factors, prevalence of modifiable risk factors, and differences in available healthcare resources for diagnosis and treatment. [33, 34, 35, 36, 37, 38]
The decline in US stroke death rates for more than 4 decades has begun to slow. According to the Centers for Disease Control and Prevention (CDC), in adults aged 35 years or older, stroke death rates declined 38% from 2000 to 2015. The annual percent change (APC) in stroke death rates changed from a 3.4% decrease per year during 2000-2003, to a 6.6% decrease per year during 2003-2006, to a 3.1% decrease per year during 2006-2013, to a 2.5% increase per year during 2013-2015. The last trend indicated a reversal from a decrease to a statistically significant increase in Hispanics (APC = 5.8%) and in persons in the South Census Region (APC = 4.2%). Declines in stroke death rates failed to continue in 38 states. During 2013-2015, an estimated 32,593 excess stroke deaths might not have occurred if the previous rate of decline had been sustained. [39, 40]
Approximately 25% of ischemic strokes are fatal within a month, nearly one third by 6 months, and 50% by 1 year. Stroke mortality is even higher for those with primary intracerebral hemorrhage and subarachnoid hemorrhage, which approach 50% mortality by one month. [5, 31]
For subarachnoid hemorrhage, the mortality is approximately 35% after the initial bleed. [41] Vasospasm is the leading cause of death in those who survive the initial hemorrhage, [42] with the peak incidence occurring 5-12 days after the aneurysm rupture. Rebleeding is also associated with a significantly increased mortality of approximately 70% in survivors of the initial bleed. [30]
Estimates of population-based studies have shown that approximately 500 per 100,000 live with the consequences of stroke with the age-adjusted prevalence for people aged 65 years or more ranging from 46.1 to 73.3 per 1000 population. It has been estimated that stroke-related disability is the sixth most common cause of reduced disability-adjusted life-years. [5]
Race, Sex, and Age
According to data published by the American Heart Association, blacks have a risk of first-ever stroke that is nearly double that for whites. The age-adjusted incidence of first ischemic stroke per 100,000 was 88 in whites, 191 in blacks, and 149 in Hispanics, according to data from the Northern Manhattan Study (NOMAS) of stroke and stroke risk factors. In a US study, researchers found that blacks had a 3-fold higher multivariate-adjusted risk ratio of lacunar stroke than whites. [1] An increased proportion of intracerebral hemorrhage and lacunar infarcts have been reported in Asia.
Stroke is an important health issue in women because their incidence of stroke exceeds that in men at older ages. This may in part be secondary to the greater lifespan of women compared to men and the effects of hormone status on cardiovascular disease following menopause. Women 45-54 years are reported to be more than twice as likely as men to suffer a stroke. Overall, 55,000 more women than men have a stroke annually in the United States. [1]
Stroke is a disease of increasing importance in the elderly population, with approximately 75% of strokes occurring in those older than 65 years. Numerous studies have demonstrated that the age-specific incidence of stroke increases with each decade of life.
Anatomy
Arterial distributions
Knowledge of cerebrovascular arterial anatomy and the territories supplied by each is useful in determining which vessel or vessels are involved in acute stroke. Atypical patterns that do not conform to a vascular distribution may indicate another diagnosis, such as venous infarction.
The cerebral hemispheres are supplied by 3 paired major arteries: the anterior, middle, and posterior cerebral arteries. The anterior and middle cerebral arteries comprise the anterior circulation and arise from the supraclinoid internal carotid arteries. The anterior cerebral artery supplies the medial portion of the frontal and parietal lobes and anterior portions of basal ganglia and anterior internal capsule. The middle cerebral artery supplies the lateral portions of the frontal and parietal lobes and the anterior and lateral portions of the temporal lobes and gives rise to perforating branches to the globus pallidus, putamen, and internal capsule.
The posterior cerebral arteries arise from the basilar artery and form the posterior circulation. The posterior cerebral artery gives rise to perforating branches that supply the thalami and brainstem and cortical branches to the posterior and medial temporal lobes and occipital lobes. The cerebellar hemispheres are supplied inferiorly by the posterior inferior cerebellar artery (PICA) arising from the vertebral artery, superiorly by the superior cerebellar artery, and anterolaterally by the anterior inferior cerebellar artery (AICA) (see the images below).
 Frontal view of a cerebral angiogram with selective injection of the left internal carotid artery illustrates the anterior circulation. The anterior cerebral artery consists of the A1 segment proximal to the anterior communicating artery with the A2 segment distal to it. The MCA can be divided into 4 segments: the M1 (horizontal segment) extends to the limen insulae and gives off lateral lenticulostriate branches, the M2 (insular segment), M3 (opercular branches) and M4 (distal cortical branches on the lateral hemispheric convexities).
 Lateral view of a cerebral angiogram illustrates the branches of the anterior cerebral artery and Sylvian triangle. The pericallosal artery has been described to arise distal to the anterior communicating artery or distal to the the origin of the callosomarginal branch of the anterior cerebral artery (ACA). The segmental anatomy of the ACA has been described as follows: the A1 segment extends from the internal carotid artery (ICA) bifurcation to the anterior communicating artery; A2 extends to the junction of the rostrum and genu of the corpus callosum; A3 extends into the bend of the genu of the corpus callosum; A4 and A5 extend posteriorly above the callosal body and superior portion of the splenium. The Sylvian triangle overlies the opercular branches of the middle cerebral artery (MCA), with the apex representing the Sylvian point.
 Frontal projection from a right vertebral artery angiogram illustrates the posterior circulation. The vertebral arteries join to form the basilar artery. The posterior inferior cerebellar arteries (PICA) arise from the distal vertebral arteries. The anterior inferior cerebellar arteries (AICA) arise from the proximal basilar artery. The superior cerebellar arteries (SICA) arise distally from the basilar artery prior to its bifurcation into the posterior cerebral arteries.
The anterior cerebral artery supplies the following structures:
-
Cortical branches - Medial frontal and parietal lobe
-
Medial lenticulostriate branches - Caudate head, globus pallidus, anterior limb of the internal capsule
The middle cerebral artery supplies the following structures:
-
Cortical branches - Lateral frontal and parietal lobes, lateral and anterior temporal lobe
-
Lateral lenticulostriate branches - Globus pallidus and putamen, internal capsule
The anterior choroidal artery supplies the following structures:
-
Optic tracts
-
Medial temporal lobe
-
Ventrolateral thalamus
-
Corona radiata
-
Posterior limb of the internal capsule
The posterior cerebral artery supplies the following structures:
-
Cortical branches - Occipital lobes, medial and posterior temporal and parietal lobes
-
Perforating branches - Brainstem, posterior thalamus, and midbrain
The posterior inferior cerebellar artery supplies the following structures:
-
Inferior vermis
-
Posterior and inferior cerebellar hemispheres
The anterior inferior cerebellar artery supplies the following structure:
-
Anterolateral cerebellum
The superior cerebellar artery supplies the following structures:
-
Superior vermis
-
Superior cerebellum (see the image below)
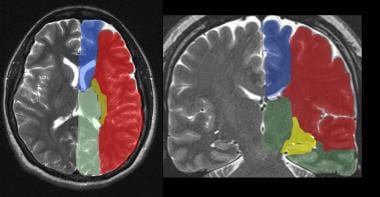 The supratentorial vascular territories of the major cerebral arteries are demonstrated superimposed on axial (left) and coronal (right) T2-weighted images through the level of the basal ganglia and thalami. The middle cerebral artery (MCA; red) supplies the lateral aspects of the hemispheres, including the lateral frontal, parietal and anterior temporal lobes, insula, and basal ganglia. The anterior cerebral artery (ACA; blue) supplies the medial frontal and parietal lobes. The posterior cerebral artery (PCA; green) supplies the thalami and occipital and inferior temporal lobes. The anterior choroidal artery (yellow) supplies the posterior limb of the internal capsule and part of the hippocampus extending to the anterior and superior surface of the occipital horn of the lateral ventricle.

(Images below illustrate vascular distributions.)
 Vascular distributions: Middle cerebral artery (MCA) infarction. Noncontrast CT scan demonstrates a large acute infarction in the MCA territory involving the lateral surfaces of the left frontal, parietal, and temporal lobes as well as the left insular and subinsular regions with mass effect and rightward midline shift. The caudate head is spared, and at least part of the lentiform nucleus and internal capsule, which receive blood supply form the lateral lenticulostriate branches of the M1 segment of the MCA. Note the lack of involvement of the medial frontal lobe (anterior cerebral artery territory), thalami and paramedian occipital lobe (posterior cerebral artery territory).
 Vascular distributions: anterior cerebral artery (ACA) infarction. Diffusion-weighted image on the left demonstrates high signal in the paramedian frontal and high parietal regions. The opposite diffusion-weighted image in a different patient demonstrates restricted diffusion in a larger ACA infarction involving the left paramedian frontal and posterior parietal regions. Infarction of the lateral temporoparietal regions bilaterally (both MCA distributions) also exists; it is greater on the left, indicating multivessel involvement suggesting emboli.
 Vascular distributions: posterior cerebral artery (PCA) infarction. The noncontrast CT images demonstrate PCA distribution infarction involving the right occipital and inferomedial temporal lobes. The image on the right demonstrates additional involvement of the thalamus, also part of the PCA territory.
 Vascular distributions: Anterior choroidal artery infarction. The diffusion-weighted image (left) demonstrates high signal with associated signal dropout on the apparent diffusion coefficient (ADC) map involving the posterior limb of the internal capsule. This is the typical distribution of the anterior choroidal artery, the last branch of the internal carotid artery before bifurcating into the anterior and middle cerebral arteries. The anterior choroidal artery may also arise from the middle cerebral artery (MCA).
Stroke in the young patient
A number of different diseases can result in ischemic stroke in the young patient. These include cardioembolic disease, dissection, inherited structural and metabolic abnormalities, thrombophilias, pregnancy, and drug use, as follows [5, 43, 44, 45] :
-
Cardioembolic strokes can be seen in patients with risk factors such as arrhythmias; congenital structural defects such as patent foramen ovale; and valvular heart disease, including both native and prosthetic valves.
-
Dissection can be seen with trauma and connective tissue disorders, such as Marfan and Ehler-Danlos syndrome.
-
Inherited abnormalities include inherited forms of hyperlipidemia, such as autosomal dominant hypercholesterolemia, cerebral autosomal dominant arteriopathy with subcortical infarcts, and leukoencephalopathy (CADASIL), and numerous other congenital metabolic abnormalities.
-
Vasculitides, including lupus and Behçet disease can also produce ischemic infarction.
-
Pregnancy creates a hypercoagulable state by increasing the amounts of certain clotting factors, with stroke and hypertensive encephalopathy being potential complications of pregnancy induced hypertension and eclampsia.
-
Drugs, both prescribed and illicit (especially cocaine), may result in ischemic infarction.
Computed Tomography
Noncontrast CT
On noncontrast CT scan, early findings (within 6 hours) include subtle loss of gray-white differentiation corresponding to increased water content from early cytotoxic edema. [46, 47, 2, 48, 49, 50] Loss of definition of cortex and obscuration of deep gray matter structures may exist.
In middle cerebral artery infarction, obscuration of lateral margins of the insula, (the insular ribbon sign) and loss of density of the basal ganglia nuclei, such as the lentiform nucleus (vanishing basal ganglia sign), may exist (see the images below).
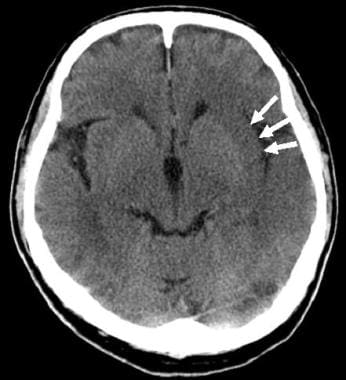 Noncontrast CT was obtained to evaluate this 64-year-old male who awoke with aphasia and right-sided weakness. Loss of the normal gray-white differentiation between the normally denser insular cortex and the less attenuating subinsular white matter is seen; this is consistent with loss of the "insular ribbon."
 Follow-up noncontrast CT scan obtained approximately 12 hours after the initial study in the same patient demonstrates further evolution of the infarction, which is now extensive and spans most of the left middle cerebral artery (MCA) territory.
 Noncontrast CT scanning was performed to evaluate this 70-year-old female with a history of acute onset of right-hand weakness and aphasia. Loss of gray-white differentiation in the left insular cortex and in the immediately adjacent cortical and subcortical portions of the left temporal operculum is seen; this is strongly suggestive of an acute infarction.
Hyperattenuation of vessels may be seen (dense vessel sign or dot sign); these are believed to represent acute thrombus or embolus and has been described in the MCA, basilar artery, and venous sinuses (see the images below).
 Noncontrast CT scan in an 80-year-old female who presented with acute onset of right-sided weakness. The left middle cerebral artery (MCA) trunk appears highly attenuated (the dense MCA sign), suspicious for acute thrombosis or embolism. A follow-up noncontrast CT demonstrated an evolving infarct of the lentiform nucleus.
 Dense middle cerebral artery (MCA) sign: Noncontrast CT in another patient with strokelike symptoms demonstrates a hyperdense appearance of the right MCA with subtle loss of gray-white differentiation of the anterior right temporal lobe.
 Dense basilar artery: Axial noncontrast CT scan demonstrates a hyperdense basilar artery in a patient with pontine infarction who was later found to have basilar artery thrombosis. Other large vessels besides the middle cerebral artery (MCA) can produce a dense vessel sign when occluded.
After approximately 12-24 hours, a more well-defined area of hypodensity, which may have associated mass effect with sulcal or ventricular effacement, may be seen. The hypodensity is usually irreversible and is felt to correlate with minimum final infarct size. [8, 13]
Mass effect typically peaks by about 5 days post ictus and disappears over the next several weeks. [8]
In roughly one half of cases, the infarct may change from hypodense to isodense. This has been termed the "fogging effect" on CT and is usually seen 2-3 weeks post ictus during the subacute phase of infarction and should resolve on subsequent imaging. IV contrast may make the infarct more conspicuous. The phenomenon is believed to be due to influx of lipid-laden macrophages, decreased water content, proliferation of capillaries, reperfusion, and petechial hemorrhage (see the image below). [51, 52]
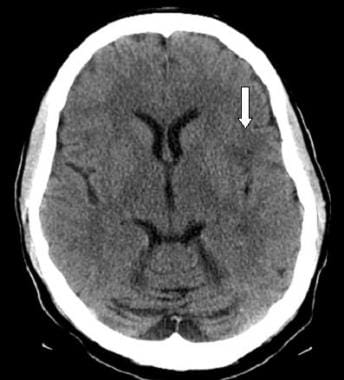
 CT fogging effect: Axial noncontrast CT scan demonstrates focal low density, loss of gray-white differentiation, and mild sulcal effacement in the right parietal region (left image, arrow) in a 62-year-old female presenting with acute stroke. A follow-up noncontrast CT scan obtained 10 days later demonstrates diminished sulcal effacement and isodensity with a near-normal appearance (middle image), thought to be secondary to the CT "fogging effect" that may be seen during the evolution of an infarct. The axial diffusion-weighted image (right) confirms the right parietal infarct.
After approximately 6-8 weeks, a well-defined cavity may be seen, corresponding to encephalomalacia. Evidence of volume loss, such as ex-vacuo dilatation of the adjacent ventricle, may exist. Cortical laminar necrosis may be seen in chronic infarcts with gyriform cortical calcification (see the images below).
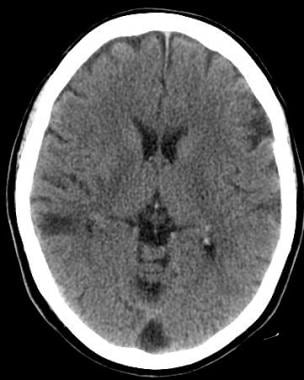
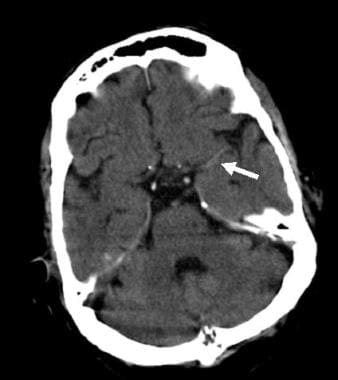
 Noncontrast CT of the brain in a patient with history of remote CVA demonstrates low density in the right frontal and anterior temporal regions in the MCA distribution. Evidence of parenchymal volume loss with ex-vacuo dilatation of the right lateral ventricle is present, indicating chronicity infarction.
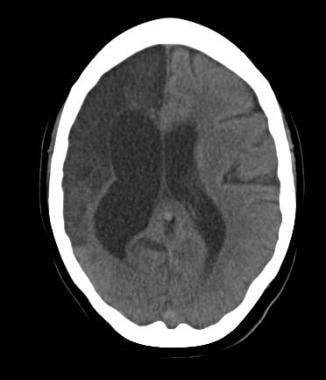
 Chronic infarction: Noncontrast CT scan demonstrates a well-defined area of volume loss in the right temporal lobe with a low-density appearance consistent with encephalomalacia. No mass effect exists.
Lacunar infarcts appear as small, 5-15 mm areas of low density initially. After approximately 4 weeks, lacunar infarcts should appear as well-defined, cystic low-density areas. Typical locations include the subinsular regions, basal ganglia, thalami and capsular regions, and corona radiata.
Findings on NCCT during the hyperacute phase may be extremely subtle, and a high index of suspicion should be maintained when interpreting the examination. The characteristic findings, namely parenchymal hypodensity, obscuration of gray-white differentiation, and sulcal effacement, are strongly suggestive.
The previously held concept that most studies obtained within 6-12 hours are generally negative was likely related to the limited capabilities of early equipment. In one study, imaging done within 4-6 hours of acute stroke onset showed changes of early infarct in approximately 70% of patients. Another study performed on patients within 5 hours of angiographically proven acute MCA occlusion showed evidence of infarction in 81%. [53, 54, 55]
Soft copy image review using variable window width and center level settings may further facilitate detection of parenchymal hypodensity and acutely ischemic tissue. [56]
In a study of 252 patients presenting with atypical stroke symptoms in the ED and negative findings on head CT, subsequent MRI identified acute to subacute infarct in 29 of those patients. The mean age of the MRI-positive group was 74 years. The study authors noted that in elderly patients with a history of prior stroke or transient ischemia attack, a lower threshold should be maintained for ordering a head MRI despite a negative head CT. [57]
False-positive areas of hypoattenuation may be seen due to beam hardening artifact from bone along the cerebral convexities from the adjacent calvaria and in the posterior fossa due to the skull base. Streak artifacts may also cause parenchymal hypodensity adjacent to aerated sinuses. The typical location and appearance, linearity, and extension beyond brain parenchyma should all help identify these artifacts.
Artifactual hypodensity may be seen when the cortex is volume-averaged with adjacent cerebrospinal fluid in a sulcus, fissure, or cistern.
Various other lesions may produce focal areas of hypodensity both with and without mass effect, including perivascular spaces, infiltrative tumors with vasogenic edema, and encephalitis.
The CT “fogging” effect may transiently produce isodensity of an infarct that always resolves on follow-up imaging.
Quantification of zone of ischemia
Noncontrast CT scanning can be used to estimate the area of ischemic tissue in order to guide therapy. This concept is postulated on evidence-based guidelines that state that larger infarcts, specifically greater than one third of the MCA distribution, are more likely to hemorrhage following thrombolytic therapy. [13, 25, 58]
One classification system, the Alberta Stroke Programme Early CT Score (ASPECTS) uses a 10-point scoring system to quantify acute ischemia on noncontrast CT based upon degree of involvement of the MCA territory. The ASPECTS system divides the MCA territory into 10 regions and deducts a point for each region involved. Thus, a normal MCA territory would receive a score of 10, and diffuse MCA involvement would receive a score of 0. Lower scores correlate with worse stroke severity and higher risk of symptomatic hemorrhage (see the images below). [59, 60, 61, 62]
 ASPECTS quantitative stroke scoring system: For ASPECTS scoring, the middle cerebral artery (MCA) territory is allotted 1 point for each of 10 separate regions: M1, M2, M3, M4, M5, M6, the caudate nucleus (C), lentiform nucleus (L), insular cortex (I), and internal capsule (IC). Scoring is based on a section at the level of the basal ganglia and thalami and another section above the level at the basal ganglia. One point is subtracted for each area demonstrating signs of early ischemic change, such as focal parenchymal hypoattenuation or edema. A normal scan would be scored a 10, and diffuse edema involving all points would be scored 0.
 Noncontrast CT scan performed in a 60-year-old male who presented with acute stroke demonstrates the use of the ASPECTS. Diffuse hypodensity is noted throughout the middle cerebral artery (MCA) distribution involving the M1-M6 regions and insula. Seven points are then subtracting from the 10-point ASPECTS, yielding a score of 3. C = caudate nucleus, L = lentiform nucleus, I = insular cortex, and IC = internal capsule.
Another classification instrument, the Boston Acute Stroke Imaging Scale (BASIS), can also help predict patient outcome. BASIS uses data about the patency of vasculature on CTA or MRA and presence of early ischemic parenchymal changes on noncontrast CT or MRI to classify stroke as major or minor. Large vessel occlusions or significant ischemic changes are classified as major stroke; if both changes are absent, the stroke is classified as minor. Survivors of major stroke, as classified by BASIS, have been found to have significantly longer hospital stays and are subsequently much more likely to be discharged to a rehabilitation facility rather than home. [63]
Contrast-enhanced CT
Contrast enhancement following brain infarction is typically seen in about two thirds of cases, usually during the second or third week post ictus. Common patterns of enhancement include patchy, gyriform, ring-like, and homogeneous. Earlier contrast enhancement corresponds to infarcts with larger volume and mass effect and is secondary to disruption of the blood-brain barrier with increased vascular permeability and/or reperfusion from recanalization or collateral circulation. Early contrast enhancement portends an increased risk of hemorrhagic transformation.
CT angiography
The most important purpose of CTA in acute stroke is to detect vessel thrombosis or occlusion. Thrombus characterization is increasingly considered important in predicting treatment success for patients with acute ischemic stroke. [64, 65, 66] CTA source images should always be assessed, in addition to multiplanar reconstruction (MRP) and maximum intensity projection (MIP) images. Proper interpretation requires attention to luminal enhancement to assess vessel patency, intimal flaps to exclude dissection, filling defects and vessel wall calcifications to assess stenosis, and occlusions and focal outpouchings suggestive of aneurysm or pseudoaneurysm (see the image below).
CTA has been demonstrated to be highly reliable for the detection or exclusion of large intracranial vessels, such as the ICA and MCA trunk up to the M2 segment and basilar arteries.
Using multidetector CT with voxel sizes well below 1 mm and postprocessing tools, CTA is highly accurate in measuring vessel diameters adjacent to stenosis and is superior for grading of intracranial stenosis compared with 3D TOF MRA technique. [67]
CTA has the advantage over MRA and DSA of detecting mural calcifications in relation to stenosis. However, in an 11-year retrospective study of patients with CTA-negative subarachnoid hemorrhage (SAH), digital subtraction angiography (DSA) identified vascular pathology in 13% of patients with CTA-negative SAH. Aneurysms or pseudoaneurysms are identified in an additional 4% of patients by repeat DSA following an initially negative DSA. [68]
Use of varied window setting is required to assess luminal patency within the vessel when it is surrounded by calcified thrombus.
In addition to vascular occlusions, CTA source images are able to demonstrate hypoperfused brain parenchyma in acute stroke similar to DWI images.
 MIP and surface volume rendered images of the circle of Willis from a CTA in a 70-year-old female with acute onset right-sided weakness. A high-grade stenosis of the distal left middle cerebral artery (MCA) trunk (red circles) is seen, with filling of the remainder of the MCA territory via an anterior branch near the bifurcation.
In addition to vascular anatomy, regions of parenchymal hypoperfusion can also be assessed with CTA. Regions of diminished flow on CTA source images have also been shown to correlate well with the infarct core (see the image below). [13]
 CTA source data can also be useful to assess for areas of hypoperfusion and poor enhancement that may correspond to areas of greatest ischemia. This CTA source image from the patient in the previous case demonstrates significantly diminished enhancement involving the caudate head, lentiform nucleus, and capsular regions. High density noted centrally in this poorly enhancing region represents an area of hemorrhagic transformation.
CT perfusion
Perfusion maps can usually be compared visually to qualitatively look for areas of gross or subtle asymmetry. Quantitative CBF values can also be examined with thresholds for ischemic and infarcted tissue in mind. A low CBV abnormality best correlates with the infarct core. [13, 69, 70]
In the early stages of stroke, the extent of regionally abnormal MTT has been found to exceed that of abnormal CBV and CBF, making it the most sensitive parameter for detecting decreased perfusion and ischemia. Prolonged MTT, however, has been found to overestimate final infarct size. [71, 72, 73]
CBV and CBF maps generally show smaller areas of abnormality than MTT and are therefore more specific for areas of ischemia and infarction.
The mismatch between abnormal CBV and abnormal CBF estimates the penumbra. [74, 75]
Another method to classify ischemic tissue involves measuring the CBF in the contralateral normal brain parenchyma and comparing it to the CBF in the area of perfusion abnormality to create a CBF ratio (see the images below). [76] Shaefer et al found the following threshold ratio values between the abnormal ischemic region and normal contralateral side relating to the ischemic core and penumbra and mean CBF ratios (p< 0.05) [76] :
-
Infarct core: 0.19 +/- 0.06
-
Penumbra likely to go on to infarction: 0.34 +/- 0.06
-
Salvageable penumbra: 0.46 +/- 0.06.
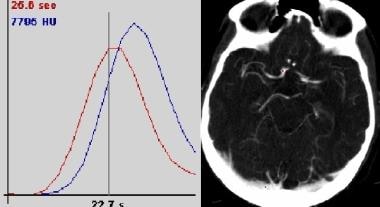 Placement of ROI curves on arterial and venous pixels (image on right) are needed to generate time-concentration curves for perfusion imaging. These curves can then be used to generate perfusion maps.
 After selecting the appropriate arterial and venous input functions, the computer software is able to generate perfusion maps of different parameters (CBF = cerebral blood flow, CBV = cerebral blood Volume, MTT = mean transit time, TTP = time to peak enhancement). Regions of interest can then be placed over these maps for quantitative information. In this patient with occlusion of the distal left MCA trunk, elevated MTT and diminished CBF exists in the left basal ganglia, insular and opercular regions. The CBV is mildly increased in this same region, which is believed to be due to autoregulatory vasodilation in response to ischemia.


The high sensitivity of MTT for decreased perfusion may make it less specific in detecting clinically significant ischemia. One study reported elevated MTT in an asymptomatic patient with proximal occlusion of the carotid artery but likely good collateral supply and in another patient who had reversible ischemic symptoms and a negative CTA. [71]
Although the regional abnormality in CBV has been said to best estimate infarct volume, CBV may also be normal or elevated in acute stroke. This may be secondary to autoregulatory changes and collateral flow to ischemic brain tissue. CBV had been reported in the same study above to be normal in 25% of patients with acute stroke. [71]
Magnetic Resonance Imaging
Conventional MRI
High signal intensity may be seen on T2WI and proton density–weighted images beginning approximately 8 hours after onset corresponding to a vascular distribution. T1WI may take significantly longer to demonstrate low signal. [77, 78] Conventional MRI may take hours to produce discernible findings, well after the diffusion-weighted images have become positive. For this reason, many centers always include diffusion-weighted images in their standard brain MRI protocol. [79, 80, 81]
FLAIR images demonstrate abnormal signal sooner than T2WI and have been shown to be useful in detecting infarcts within 3 hours after onset of acute stroke. [82]
FLAIR images may also demonstrate intra-arterial signal that is hyperintense or isointense to gray matter. This is believed to occur immediately after occlusion, similar to the dense vessel sign seen on CT. [82]
FLAIR images have been shown to be more sensitive to detect acute stroke than standard T2WI, with a sensitivity of greater than 90% and in as little as 80 minutes in one study. This is likely due to higher T2 weighting capability of FLAIR compared to standard T2WI. [77, 78]
The FLAIR intra-arterial sign has been reported to have an extremely high degree of detectability for occluded vessels within 6 hours after stroke. [82]
FLAIR images are highly sensitive for subarachnoid hemorrhage, approaching 100% for large volumes of hemorrhage. [83]
GRE (T2 images) are likely the most sensitive for detecting blood products. [84, 85, 86]
FLAIR images can demonstrate high signal in the subarachnoid spaces with SAH (see the image below).
 Axial FLAIR image demonstrates intra-arterial high signal in the left middle cerebral artery (MCA) of this patient with early stroke. The intra-arterial high signal has been postulated to be secondary to different factors, including stasis, slow or reversed flow, and thrombus.
Diffusion-weighted imaging
Acutely ischemic lesions demonstrate high signal of DWI and low signal on ADC maps within minutes. [87] Diffusion-weighted images are considered to be the most reliable marker of ischemic core and can detect ischemia within 30 minutes. [13, 88, 89, 90, 91]
DWI may demonstrate high signal for several weeks. This is due to T2-weighted effects predominating over the apparent diffusion in early and subacute infarctions. [92] Confirmation with the ADC map for a corresponding area of signal loss is needed to confirm the abnormal DWI to avoid the problem of T2 “shine through.”
Falsely negative and reversible areas on diffusion images can be seen if only very mild ischemia exists, if the area of ischemia is very small, or if it is very early in the course of the ischemic event.
Abnormal signal of DWI has been reported to normalize in as little as 14 days, [93] although more recent data has observed normalization at an average of approximately 56 days. [92] However, DWI signal abnormality has been reported to last up to 72 days. This is large part due to "shine-through" effects of the T2-weighting of DWI. [92, 94]
In a study of 92 patients with erly stages of stroke, the sensitivity of DWI alone was 95% and reached 100% in conjunction with perfusion MR. [2]
In contrast, the ADC abnormality typically peaks by 3 days and pseudonormalizes during the subacute period between the 7th and 11th day after infarction and is a much more accurate assessment of infarct age. [92]
To confirm whether high signal on DWI represents acute infarction, one must match the high signal on the DWI to low signal on ADC maps (see the images below).
 Noncontrast CT scan and MRI of the brain with DWI was performed to evaluate this 87-year-old male with history of recurrent strokes and new change in mental status. Noncontrast CT scan demonstrates a right PCA distribution hypodensity, and a hypodensity at the vertex on the right near the MCA/ACA borderzone. Both of these abnormalities are age indeterminate on the CT scan.
 MRI was obtained to further clarify the findings on a noncontrast CT scan. High signal on the DWI and corresponding low signal on the ADC maps in the right frontal vertex borderzone area are seen. This signifies true restricted diffusion and an acute infarction.
 The right posterior cerebral artery (PCA) distribution infarction is most likely chronic. The high signal on the DWI has no corresponding low signal on the ADC map (red circle). The ADC map demonstrates slightly elevated signal in this case. The falsely persistent high signal on DWI in the absence of recent infarction is felt to be related to the partial T2-effects of DWI and is referred to as "T2 shine through."
Contrast-enhanced MRI
Intra-arterial contrast enhancement may be seen secondary to slow flow during the first or second day after onset of infarction and has been correlated with increased infarct volume size. [95]
Early parenchymal enhancement on MRI by the end of the first week has been reported as an expected finding from disruption of the blood-brain barrier and development of granulation tissue later. It is correlated with an increased risk of hemorrhagic transformation but no risk of increased infarct size (see the image below). [95]
 Axial T1-weighted postcontrast image obtained in a patient with recent stroke demonstrates arterial enhancement within the left middle cerebral artery (MCA) as well as cortical and subcortical enhancement in the adjacent insular and opercular regions. The arterial enhancement is believed to be due to slow flow and underlying impaired hemodynamics. Early parenchymal enhancement may indicate good collateral supply.
Magnetic resonance angiography
Three different techniques can be used to produce MRA, as follows:
Time of flight (TOF): TOF takes advantage of the higher signal from protons in flowing blood, compared with protons in stationary tissue that become partially saturated and lose signal when exposed to a radiofrequency (RF) pulse. Areas of signal loss and narrowing correspond to stenosis and occlusions.
Phase contrast (PC): PC involves tagging the spins of moving protons using bidirectional gradients and marking their changes in position when each gradient is applied. PC is exquisitely sensitive to flow, which the operator can choose the velocity threshold for, and gives excellent background suppression.
Contrast-enhanced MRA (CEMRA): CEMRA uses the intraluminal signal produced by a timed bolus of paramagnetic contrast material to evaluate vessel patency. Images may be single phase (ie, arterial) or time resolved.
The flow-related enhancement on TOF images is a T1 effect. Similarly, clot-containing methemoglobin may also create intravascular high signal that is indistinguishable from signal related to flow. Phase contrast images are not susceptible to this problem.
Signal loss may be seen when images vessels are imaged in the plane of the scan.
Susceptibility effects may cause signal loss in cavernous portion of the internal carotid artery adjacent to the sphenoid sinus.
As previously discussed, the most widely used vascular MRI techniques are 3DTOF and gadolinium enhanced MRA (see the images below).
 TOF MRA demonstrates an occlusion or high-grade stenosis at the mid to distal right middle cerebral artery (MCA) trunk. MRA is highly accurate at helping to evaluate large intracerebral vessel stenosis, although less reliable than CT scanning at helping to grade stenosis.
 3D time-of-flight (TOF) of the neck axial and MIP images demonstrates a 2-cm low-signal curvilinear dissection flap in the mid right vertebral artery. This patient has a history of fibromuscular dysplasia and prior carotid artery dissection.
Perfusion MRI
The most commonly used technique for MR perfusion imaging is dynamic susceptibility, which involves generating maps of brain perfusion by monitoring the first pass of a rapid bolus injection of contrast through the cerebral vasculature. A large amount of data exists confirming the sensitivity of combining diffusion and perfusion weighted MRI to detect the ischemic penumbra and also predict the potential final infarct size without treatment. [13]
Maps of time to peak (TTP) or mean time to enhancement (MTE) are very sensitive to alterations in blood flow, similar to MTT CT perfusion maps. However, these maps may also overestimate the amount of significantly ischemic tissue.
CBV also may be artificially elevated in response to hypoperfusion due to compensatory autoregulatory mechanisms.
The sensitivity of each MR perfusion map varies in its ability to depict areas of ischemia, similar to CT perfusion parameters. Susceptibility related T2 effects create signal loss in capillary blood vessels and parenchyma perfused by contrast that can be measured and is proportional to the cerebral blood volume (see the image below).
 Regions of interest are selected for arterial and venous input (image on left) for dynamic susceptibility-weighted perfusion MRI. Signal-time curves (image on right) obtained from these ROI demonstrate transient signal drop following the administration of intravenous contrast. The information obtained from the dynamic parenchymal signal changes post contrast are used to generate maps of different perfusion parameters.
Areas of prolonged mean transit time (MTT) correspond to areas of ischemia and areas of diminished cerebral blood volume correlate best with the areas of irreversible ischemic change. The difference between the perfusion abnormality and diffusion abnormality reflects the ischemic penumbra around the infarct core (see the images below).
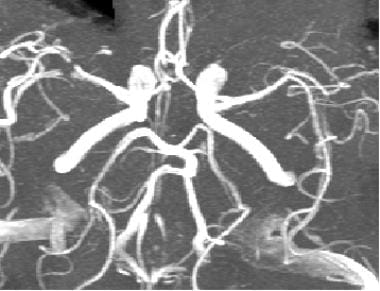
 Left internal carotid artery (ICA) occlusion: Axial FLAIR images demonstrate high signal in the centrum semiovale in the deep borderzone region with corresponding restricted diffusion, indicating infarction. MIP from a time-of-flight MRA of the circle of Willis demonstrates no flow in the left ICA or anterior circulation on the right.
 Left internal carotid artery (ICA) occlusion: MR perfusion imaging demonstrates global and marked elevation in mean transit time (image on left) in most of the left cerebral hemisphere, sparing only part of the posterior circulation. This demonstrates how MTT is extremely sensitive to abnormalities in perfusion. The CBV (image on right) is markedly depressed more centrally in the deep and subcortical white matter, consistent with the infarction noted on DWI.
Ultrasonography
Carotid ultrasound
Doppler ultrasound is the most common imaging examination performed for the diagnosis of carotid stenosis worldwide. The prevalence of significant (50%) stenotic disease in symptomatic patients is stated as being in the range of 18-20%, while the prevalence in asymptomatic patients with clinical markers for significant atherosclerotic disease who are referred for carotid imaging is 14%. [58, 59, 96, 97]
All sonographic examinations of the carotid arteries should be performed using grayscale, color Doppler ultrasound, and spectral Doppler ultrasound analysis to detect luminal patency, presence of plaque, dissection flaps, velocity, and direction of blood flow.
Changes in both plaque texture and plaque volume have been shown to be strongly predictive of vascular events. In high-risk patients, 3D ultrasound plaque measurements should be considered for prediction of the risk of vascular event. [98] Grayscale images provide a gross analysis of luminal patency and assessment of calcified or soft plaque and intimal thickening. Color and power Doppler ultrasound measurements can depict residual lumen in cases of high-grade stenosis to better advantage than grayscale images. Spectral Doppler provides velocity measurements that are used to specifically grade stenosis.
The consensus panel of the Society of Radiologists in Ultrasound has stratified degrees of carotid stenosis using the following major criteria: [97]
No narrowing is reported if the ICA peak systolic velocity is below 125 cm/s with no plaque or intimal thickening.
Less than 50% stenosis is reported when ICA PSV is less than 125 cm/s but plaque or intimal thickening is visible sonographically.
Fifty to 70% stenosis is reported when ICA PSV is 125-230 cm/s exists with visible plaque.
More than 70% stenosis but less than near occlusion is reported when ISA PSV is more than 230 cm/s with visible plaque and significant but not near complete luminal narrowing.
Near complete occlusion is diagnosed by demonstrated marked narrowing on color Doppler or power Doppler ultrasound. PSV is less reliable in this case.
Total occlusion is present when no patent lumen is identified on grayscale images or on color, spectral, or power Doppler ultrasound. Total occlusion needs to be confirmed with CTA, MRA, or conventional angiography.
If a dissection is identified, the proximal and distal extents need to be identified. This may require further imaging with CT or MRI (see the images below).
 Color Doppler ultrasound of the left internal carotid artery was obtained in a 57-year-old male with history of transient ischemic attacks. A large amount of plaque is seen in the proximal left internal carotid artery producing a high-grade stenosis. However, color flow is noted distal to the stenosis.
 Pulsed Doppler waveforms in the same patient demonstrate a markedly elevated peak systolic velocity in the proximal internal carotid artery (ICA) of 252 cm/s. The second waveform, obtained more distally in the same stenosis, demonstrates a velocity of greater than 400 cm/s. The stenosis is more than 70 and, based on gray scale and color flow assessment, appears near occlusive. This illustrates the importance of carefully sampling along the course of a stenosis for the highest peak systolic velocity.
 Digital subtraction angiogram performed in the same patient as previous photo confirms the near occlusion with a "string sign" in the proximal left internal carotid artery.
Transcranial Doppler
Transcranial Doppler evaluates cerebral blood flow velocity and detects microembolic signals in patients who suffer from cerebral or retinal ischemia. Microembolic signals in symptomatic carotid artery stenosis are associated with an increased risk of a recurrent ipsilateral focal ischemia and correlate with a greater number of MRI-detectable cerebral infarcts when compared with patients free from microembolism. [99]
Transcranial Doppler images are obtained by placing a low-frequency probe in the temporal area above the zygomatic arch. Transorbital views can also be used to evaluate the ophthalmic artery, and transforaminal views through the foramen magnum can be used to evaluate the vertebrobasilar arterial system. The cerebral arteries can be localized based on depth measurements and color flow images (see the image below).
 Transcranial Doppler demonstrates pulsatile flow in the right-middle cerebral artery in a 40-year-old patient following subarachnoid hemorrhage and vasospasm. At a depth of 58 mm (near the origin of the middle cerebral artery [MCA]), a markedly elevated peak systolic flow velocity of approximately 251 cm/s and a mean velocity of approximately 164 cm/s indicates severe MCA stenosis. Normal peak and mean MCA flow velocities are approximately 100 cm/s and 50 cm/s, respectively.
Degree of confidence
Duplex ultrasound is an excellent tool for screening the level of stenosis in the ICA above or below a single degree of severity. However, it is less accurate in specifically quantifying the degree of stenosis in a given carotid artery. Doppler ultrasound is least accurate in diagnosing moderate degrees of stenosis (50-69%), often overestimating the amount of stenosis in this category. [100, 101]
Transcranial Doppler ultrasonography has proven to be a very useful bedside method to evaluate cerebral blood flow noninvasively. This technique is of particular value for the detection of vasospasm following subarachnoid hemorrhage, for evaluating the cerebral circulation in occlusive disease of the carotid and vertebral arteries, and for even assessing vascular malformations. [102, 103, 104] Intraoperative transcranial Doppler ultrasonography has enabled clinicians to lower the rate of serious carotid endarterectomy complications, such as thromboembolic stroke, from 4% to 0.2% through detection of the middle cerebral artery flow cessation due to the intraluminal carotid artery thrombosis. [99]
False positives/negatives
Ultrasound is an operator-dependent modality, and errors may occur with improper technique. For example, inaccurate Doppler waveforms and velocities may be obtained with improper applied angles of insonation. Maintaining a constant angle of 60% is believed to yield the most accurate results. [97]
Abnormal velocities may be seen from stenosis beyond the areas that can usually be evaluated with ultrasound, namely the intracranial internal carotid artery, aortic arch, and common carotid artery origin. Although the aortic arch can be assessed with standard ultrasound, its evaluation is not part of routine carotid ultrasound examinations.
Near-complete occlusion may produce velocities that are high, low, or undetectable. [97] Also, identification of residual patent lumen not appreciable on grayscale images requires careful color Doppler and power Doppler sonographic analysis.
Elevated velocities without corresponding levels of stenosis may be seen in patients with high-grade stenosis in the contralateral carotid system or in patients with hyperdynamic cardiac states. Similarly, low velocities may be seen with more proximal flow limiting stenosis or in patients with low cardiac output.
High-grade internal carotid stenoses may produce an abnormal high resistance and low-end diastolic flow waveform in the common carotid due to external carotid artery shunting.
Nuclear Imaging
Functional imaging with positron emission tomography (PET) and single photon emission computed tomography (SPECT) are able to reveal carotid plaque vulnerability for rupture and help in evaluating brain viability by quantifying the penumbra region. Different agents can be used in PET imaging, including18 F,11 C,13 N, and15 O. [105]
PET imaging can be used to quantify areas of altered cerebral blood flow and abnormal glucose and oxygen metabolism. This can be used to elucidate areas of ischemic penumbra and infarcted tissue, as follows:
-
Regional blood flow, oxidative metabolism, and relative oxygen extraction and cerebral metabolic rate for oxygen (CMRO2) can be measured after infusion of15 O bound to water to detect areas of ongoing ischemia and necrosis.
-
Areas of ischemic penumbra correspond to regions where cerebral blood flow is decreased but oxygen extraction is increased.
-
Necrotic areas may be seen when CMRO2 falls below 65 μmol/100 gm/min. [106]
Reduced vascular reserve can also be measured with SPECT using an acetazolamide challenge. Reactivity in patients with carotid stenosis is related to stroke risk [105, 107] and can predict development of ischemic lesions in patients undergoing carotid endarterectomy.
The vulnerability of a carotid plaque to rupture can be detected by using18 F-fluorodeoxyglucose (FDG) PET. FDG is known to accumulate in inflammatory lesions with inflammation being a key feature of atherosclerosis. [105]
Other specific features of the vulnerable plaque, such as oxidized LDL accumulation and apoptosis, can be detected with radiolabeled cytokines and lipids using SPECT. [105]
PET has been described as the criterion standard for quantifying oxygen and glucose metabolism in the brain and for identify the penumbra in humans. [105] SPECT is also useful in detecting areas of abnormal blood flow. However, PET is costly and neither modality is routinely available for use in most acute clinical settings.
Angiography
Arterial occlusions are present in at least 75% of patients present with acute ischemic stroke who undergo angiography within 6-8 hours of onset of symptoms (see the image below).
 Middle cerebral artery (MCA) occlusion: This patient was a 64-year-old male who presented within 3 hours of onset of aphasia and right-sided weakness. Frontal view from a selective injection of the left internal carotid artery during a cerebral angiogram demonstrates filling of the anterior cerebral artery with an abrupt cut-off at the middle third of the M1 segment of the left MCA with no distal filling.
Arterial occlusions are found in the vast majority of patients with NIHSS (National Institutes of Health Stroke Scale) scores of 10 or higher (moderate and severe stroke), reportedly up to 97% in one recent study. [108, 109]
In patients presenting with acute stroke, most lesions are intracranial occlusions, including the carotid siphon, compared with extracranial occlusions, which comprise 25-30%. [110] Nearly half of intracranial occlusions are secondary to MCA occlusion.
Intracranial occlusions are mostly due to embolic phenomena from a cardiac source or the carotid arteries. The relative lack of intracranial atherosclerotic and atherothrombotic lesions in autopsy studies further points to emboli being the major etiology. [110]
In the carotid arterial system, significant correlations appear to occur between the size of the infarction on CT and the extent of the vessel stenosis seen on angiograms. Furthermore, the likelihood of deficit recovery is inversely proportional to the degree of pathology seen in CT, MRI, or angiography. [111]
Angiography remains the criterion standard for the imaging of vascular diseases of the brain and great vessels of the neck and serves a vital role for acute stroke intervention. However, angiography may be normal in patients with smaller and less severe strokes or with distal arterial occlusions.
Diffusion-weighted imaging is the criterion standard for imaging infarction. Perfusion imaging with MRI or CT remain the best methods for estimating the ischemic penumbra.
Negative angiograms are believed to be secondary to early recanalization or from disease in small, penetrating arteries beyond the resolution of angiography. Negative angiography becomes more frequent as angiograms are performed later after stroke onset.
Intervention
Current treatments for acute ischemic stroke include intravenous thrombolytic therapy with tPA and endovascular therapies, including intraarterial thrombolytic therapy and clot retrieval devices. Surgical management with hemispheric decompression in patients with middle cerebral artery territory infarction and associated life-threatening parenchymal edema has also been supported. [5, 112]
Advanced neuroimaging with diffusion and perfusion imaging may then serve an important role in identifying potentially salvageable tissue at risk and guiding clinical decision making regarding therapy. [13, 113, 114, 115] In acute ischemic stroke, brain tissue that has been irreversibly damaged is called the infarct core, whereas the tissue that is reversibly damaged is called penumbra. In order to save penumbra, blood flow to the area must be restored before irreversible damage occurs. When determining the management of acute ischemic stroke, the physician must consider if the benefit of saving penumbra outweighs the risk of hemorrhagic conversion into an infarct core. For example, the most favorable conditions for reperfusion therapy is one with a large penumbra and small infarct core, since the benefit of saving a significant amount of brain tissue outweighs the small risk of hemorrhagic conversion. Therefore, a need to quantify and distinguish penumbra and infarct core is essential to the management. Perfusion imaging studies have shown to be useful in this distinction. For example, one study evaluating the usefulness of CT perfusion in acute ischemic stroke found that a delayed time to the peak of residual function (DT) greater than 2 seconds in addition to a CBF < 40% accurately represents infarct core, whereas those with a CBF >40% accurately defines penumbra. [116] However, further research is needed for standardization.
Newer stroke trials have shown the benefit of using neuroimaging to select the patients who are most likely to benefit from thrombolytic therapy and the potential benefits of extending the window for thrombolytic therapy beyond previous guidelines.
The Diffusion and Perfusion Imaging Evaluation for Understanding Stroke Evolution (DEFUSE) trial demonstrated the benefit of administering IV tPA within 3-6 hours of stroke onset in patients with small ischemic cores on DWI and larger perfusion abnormalities (large ischemic penumbras).
Randomized trials have shown superior benefit of combining endovascular mechanical thrombectomy with IV rtPA versus rtPA alone. [117]
Intravenous tissue plasminogen activator
FDA approval of IV tPA was based on data from the National Institute of Neurological Disorders and Stroke (NINDS) trial, which demonstrated an excellent outcome in 50% of patients treated with IV tPA compared with 38% of controls. [8]
It was previously thought that treatment with IV tPA must be initiated within 3 hours of onset of clearly defined neurologic deficit. However, recent guidelines have changed in response to the growing number of studies that have shown a benefit in select patients within 4.5 hours of symptom onset. [25, 118]
Evidence-based guidelines have also recommended against administering IV tPA in patients with greater than one-third involvement of the middle cerebral artery distribution or with well-defined areas of hypoattenuation on CT, due to an increased risk of intracranial hemorrhage. [13, 25, 119]
Efficacy appears to be highest in moderate to less-severe strokes in which the ICA or a major cerebral artery is not occluded. [13, 120]
Patients must be carefully selected due to the small but significant increased risk of hemorrhage associated with IV tPA (see the image below).
 Thrombolytic therapy carries a small but significant risk of life-threatening hemorrhage. For this reason, carefully screening for exclusionary criteria prior to administering tPA is important; this criteria includes hemorrhage, large areas of infarction, and patient presentation beyond the 3-hour window for IV tPA or possibly beyond 6 hours for IA tPA. This case illustrates this point in a patient with normal NCCT who was treated with IV tPA for acute stroke and, over the next 2 days, developed significant hemorrhage. Hemorrhage is noted to progressively increase in size along the medial margin of the right thalamus and the third ventricle. Obstructive hydrocephalus with hemorrhage layering is seen in the dependent portions of the occipital horns.
Intra-arterial thrombolysis
Thrombolytic agents can be infused directly into an occluded vessel to dissolve the clot and recanalize the vessel. The American Heart Association (AHA)/American Stroke Association (ASA) Stroke Council has recommended that IAT may be of benefit if administered within 6 hours of acute ischemic stroke in carefully selected patients with occlusion of the MCA and who are not eligible to receive intravenous thrombolysis. [13, 121, 122]
Mechanical recanalization
For the endovascular treatment of acute ischemic stroke, the Concentric Retriever, mainly a grasping device, and the Penumbra device, which uses an aspiration function to remove clot, are available. The Multi Mechanical Embolus Retrieval in Cerebral Ischemia (MERCI) trial used the newer generation Concentric retrieval device (L5). Recanalization was demonstrated in approximately 55% of patients who did not receive tPA and in 68% of those for whom tPA was given in a group of patients with acute ischemic stroke presenting within 8 hours of onset of symptoms. Seventy-three percent of patients who failed IV tPA therapy had recanalization following mechanical embolectomy. [123] The Penumbra trial demonstrated 82% recanalization in patients when using the aspiration function of the Penumbra device. [124]
Multiple randomized controlled trials have shown that, in patients meeting criteria, endovascular therapy in addition to medical management is superior to medical management alone when endovascular thrombectomy is performed within 6-8 hours of a large vessel occlusion acute ischemic stroke in the anterior circulation. The DAWN and DEFUSE 3 trials recently showed that, in patients meeting selection criteria, endovascular thrombectomy is beneficial in large vessel occlusion strokes in the anterior circulation from 6-16 hours from the last time that patient was known to be asymptomatic and that there may be benefit up to 24 hours. [118, 125, 126, 127]
Endovascular therapy of aneurysms
Endovascular therapy using coil embolization has been increasingly used in recent years with great success as an alternative to surgical clipping, although controversy still exists over which treatment is ultimately superior.
The International Subarachnoid Aneurysm Trial (ISAT) of neurosurgical clipping versus endovascular coiling attempted to provide clarification by comparing outcomes in patients who were suitable for both treatments. In this randomized multicenter trial conducted mainly in the UK and Europe, the largest of its type, 2143 patients were randomized to either neurosurgical clipping or endovascular coiling. The ISAT reported that independent survival was higher at 1 year with endovascular coiling and that the survival benefit continues for at least 7 years. However, the small risk of late rebleeding found in both groups was higher in the endovascular coiling group, reconfirming the higher long-term anatomic cure rate of surgery. [128, 129, 130]
Endovascular treatment of aneurysms may be favored over surgical clipping in the following situations:
-
Aneurysm location that is difficult to access surgically, eg, cavernous ICA, basilar terminus
-
Small-necked posterior fossa aneurysms
-
Elderly patients
-
Patients with poor clinical grade
Factors mitigating against endovascular treatment include the following:
-
Wide-based aneurysms or those without an identifiable neck
-
Aneurysms with a vessel extending off the aneurysm dome
-
Patients with severely atherosclerotic or tortuous vessels that limit the endovascular approach
Vasospasm may be treated with intra-arterial pharmaceutical agents, such as verapamil or nicardipine or with balloon angioplasty for opening larger vessels. The combination of the 2 treatments appears to provide safe and long-lasting therapy of severe clinical significant vasospasm (see the images below). [131]
 Frontal view from a cerebral angiogram in a 41-year-old male who presented 7 days prior with subarachnoid hemorrhage from a ruptured anterior communicating artery aneurysm treated with surgical clipping. Significant narrowing of the proximal left anterior cerebral artery (ACA), left M1 segment, and left supraclinoid internal carotid artery (ICA) indicates vasospasm.
 Angiographic view in the same patient (image on left) with superimposed road map image demonstrate placement of a wire across the left M1 segment and balloon angioplasty. The left proximal anterior cerebral artery (ACA) and supraclinoid internal carotid artery (ICA) were also angioplastied and intra-arterial verapamil was administered. Follow-up image on the right after treatment demonstrates resolution of the left M1 segment and distal ICA, which are now widely patent. Residual narrowing is seen in the left proximal ACA.
 Cerebral angiogram was performed in a 57-year-old male with family history of subarachnoid hemorrhage and found on previous imaging to have a left distal internal carotid artery (ICA) aneurysm. The lateral projection from the angiogram demonstrates a narrow-necked aneurysm arising off the posterior aspect of the distal supraclinoid left ICA with an additional nipple-like projecting off the inferior aspect of the dome of the aneurysm. Mild lobulated dilatation of the cavernous left ICA is also present.
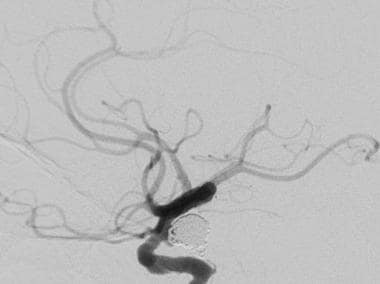 Follow-up cerebral angiogram in the same patient as previous image after coil embolization. Multiple coils were placed with sequential occlusion of the aneurysm, including the nipple at its inferior aspect. A small amount of residual filling is noted at the proximal neck of the aneurysm, which may thrombose over time.
Medical legal pitfalls
The benefits and risks should be fully described and informed consent obtained prior to any diagnostic or interventional procedure or other treatment. This includes risk of radiation exposure for patients undergoing CT scanning or angiography.
Proper screening for implanted metallic devices (eg, pacemakers and defibrillators, cochlear implants) must be obtained prior to MRI.
Prior to administering intravenous contrast for CT, MRI and angiography or any medication, history of allergies should be elicited. Alternative methods for diagnosis, including noncontrast examinations, should be pursued in all patients with history of contrast allergy. If absolutely necessary, a standard premedication regimen should be administered for those who are at risk prior to the contrast examination.
Iodinated contrast agents run the risk of contrast-induced nephropathy. The use of iodinated contrast, especially in a patient population at risk for contrast nephropathy (eg, diabetics and those with compromised renal function) should be viewed with caution and only performed if absolutely necessary. Standard prophylaxis for contrast-induced nephropathy should therefore be strongly considered in patients who are at risk before contrast administration.
Gadolinium-based intravenous contrast agents have been linked to the development of nephrogenic systemic fibrosis or nephrogenic fibrosing dermopathy (NSF/NFD) in patients with moderate to end-stage renal insufficiency. For this reason, the ACR recommends screening at-risk patients' glomerular filtration rates prior to contrast-enhanced MRI. If the MRI examination is absolutely necessary, half (or lower) dose administration of some gadolinium-based agents may be considered in patients with GFR between 30–59 mL/min per 1.73 m2. Renal consultation is recommend for those with GFR below 30 mL/min per 1.73 m2, with the ACR recommending 2 dialysis sessions within 24 hours for hemodialysis patients receiving gadolinium-based MR contrast agents, beginning as soon as the MR examination is completed. [132]
Patients must be carefully selected according to established guidelines prior to administering thrombolytics or mechanical thrombectomy due to the inherent risk of hemorrhagic conversion of a bland ischemic infarct following reperfusion.
Other procedure specific risks for cerebral angiography and neurovascular interventional procedures include embolization of thrombus in ischemic stroke, aneurysm perforation with hemorrhage during coil embolization, and arterial dissection.
Complications from femoral artery puncture include localized hematoma at the groin puncture site, retroperitoneal hematoma, dissection, pseudoaneurysm, and arteriovenous fistula formation.
-
Axial noncontrast computed tomography (NCCT) demonstrates diffuse hypodensity in the right lentiform nucleus, with mass effect upon the frontal horn of the right lateral ventricle. The patient is a 70-year-old female with history of left-sided weakness for several hours duration.
-
MRI was subsequently obtained in the same patient. An axial T2 FLAIR image (left) demonstrates high signal in the lentiform nucleus with mass effect. The axial diffusion-weighted image (middle) demonstrates high signal in the same area with corresponding low signal on the apparent diffusion coefficient (ADC) maps, consistent with true restricted diffusion and an acute infarction. Maximum intensity projection from a 3D time-of-flight MRA (right) demonstrates occlusion of the distal middle cerebral artery (MCA) trunk (red circle).
-
Axial noncontrast CT scan of the brain in a 60-year-old male with history of acute onset of left-sided weakness demonstrates 2 areas of intracerebral hemorrhage in the right lentiform nucleus with surrounding edema and effacement of the adjacent cortical sulci and right sylvian fissure. Mass effect is present upon the frontal horn of the right lateral ventricle with intraventricular extension of hemorrhage.
-
Noncontrast CT of the brain (left) demonstrates an acute hemorrhage in the left gangliocapsular region with surrounding white matter hypodensity consistent with vasogenic edema. T2-weighted axial MRI (middle image) demonstrates the hemorrhage with surrounding high-signal edema. The coronal gradient echo image (right) demonstrates susceptibility related to the hematoma with markedly low signal adjacent the left caudate head. Gradient echo images are highly sensitive for blood products.
-
Noncontrast CT (left) obtained after this 75-year-old male was admitted for CVA; scan demonstrates a large right middle cerebral artery distribution infarction with linear areas of developing hemorrhage. These become more confluent on day 2 of hospitalization (middle image), with increased mass effect and midline shift. Massive hemorrhagic transformation occurs by day 6 (right) with increased leftward midline shift and subfalcine herniation. Obstructive hydrocephalus is also noted with dilatation of the lateral ventricles, likely due to compression of the foramen of Monroe. Intraventricular hemorrhage is also noted, layering in the left occipital horn. Larger infarctions are more likely to undergo hemorrhagic transformation and are one contraindication to thrombolytic therapy.
-
This 60-year-old female underwent NCCT after an episode of left upper extremity weakness. NCCT demonstrates cortical and subcortical hypodensity involving the right mid to anterior temporal lobe.
-
MIP image from a CTA demonstrates a filling defect or high-grade stenosis at the branching point of the right MCA trunk (red circle), suspicious for thrombus or embolus. CTA is highly accurate in detecting large vessel stenosis and occlusions, which comprise approximately one third of ischemic strokes.
-
Cardioembolic stroke: Axial diffusion-weighted images demonstrate scattered foci of high signal in the subcortical and deep white matter bilaterally in a patient with a known cardiac source for embolization. An area of low signal in the left gangliocapsular region may be secondary to prior hemorrhage or subacute to chronic lacunar infarct. Recurrent strokes are most commonly secondary to cardioembolic phenomenon.
-
Axial noncontrast CT demonstrates a focal area of hypodensity in the left posterior limb of the internal capsule in this 60-year-old male with new onset of right-sided weakness. The lesion demonstrates high signal on the FLAIR sequence (middle image) and DWI (right image), with low signal on the ADC maps, indicating an acute lacunar infarction. Lacunar infarcts are typically no more than 1.5 cm in size and can occur in the deep gray matter structures, corona radiata, brainstem, and cerebellum.
-
Noncontrast CT scan was performed emergently in this 71-year-old male who presented with acute onset of severe headache and underwent rapid neurologic deterioration requiring intubation. The noncontrast CT (left image) demonstrates diffuse, high-density subarachnoid hemorrhage in the basilar cisterns and both Sylvian fissures. Diffuse loss of gray-white differentiation is present. The FLAIR image demonstrates high signal throughout the cortical sulci, basilar cisterns, and in the dependent portions of the ventricles. FLAIR is highly sensitive to acute subarachnoid hemorrhage because of the suppression of high CSF signal lending to greater conspicuity of SAH compared with conventional MRI sequences.
-
MRI was obtained to evaluate this 62-year-old hypertensive and diabetic male with history of transient episodes of right-sided weakness and aphasia. The FLAIR image (left) demonstrates patchy areas of high signal arranged in a linear fashion in the deep white matter, bilaterally. This configuration is typical for deep borderzone or watershed infarction; in this case, the anterior and posterior middle cerebral artery (MCA) watershed areas. The left-sided infarcts have corresponding low signal on the ADC map (right), signifying acuity. An old left posterior parietal infarct is noted as well.
-
This patient subsequently underwent a CTA and subsequent cerebral angiography. Multiple aneurysms were identified, including a 9-mm aneurysm at the junction of the anterior cerebral and posterior communicating arteries seen on this lateral view of an internal carotid artery (ICA) injection. Balloon-assisted coil embolization was performed.
-
Middle cerebral artery (MCA) occlusion: This patient was a 64-year-old male who presented within 3 hours of onset of aphasia and right-sided weakness. Frontal view from a selective injection of the left internal carotid artery during a cerebral angiogram demonstrates filling of the anterior cerebral artery with an abrupt cut-off at the middle third of the M1 segment of the left MCA with no distal filling.
-
Noncontrast CT was obtained to evaluate this 64-year-old male who awoke with aphasia and right-sided weakness. Loss of the normal gray-white differentiation between the normally denser insular cortex and the less attenuating subinsular white matter is seen; this is consistent with loss of the "insular ribbon."
-
Follow-up noncontrast CT scan obtained approximately 12 hours after the initial study in the same patient demonstrates further evolution of the infarction, which is now extensive and spans most of the left middle cerebral artery (MCA) territory.
-
Lateral view of a selective injection of the left internal carotid artery demonstrates a microcatheter passing distal to the aneurysm neck. This lateral view from an angiogram performed during balloon-assisted coil embolization demonstrates significantly diminished filling of the aneurysm.
-
Noncontrast CT scanning was performed to evaluate this 70-year-old female with a history of acute onset of right-hand weakness and aphasia. Loss of gray-white differentiation in the left insular cortex and in the immediately adjacent cortical and subcortical portions of the left temporal operculum is seen; this is strongly suggestive of an acute infarction.
-
Noncontrast CT scan from the patient in the previous image is re-examined using narrower windows to accentuate any hypodensity (window width, 10 HU; center, 30 HU). The hypodensity in the insular and subinsular regions is more conspicuous. Using varying window width and center levels can aid in the detection of early ischemic changes.
-
Noncontrast CT scan in an 80-year-old female who presented with acute onset of right-sided weakness. The left middle cerebral artery (MCA) trunk appears highly attenuated (the dense MCA sign), suspicious for acute thrombosis or embolism. A follow-up noncontrast CT demonstrated an evolving infarct of the lentiform nucleus.
-
Dense middle cerebral artery (MCA) sign: Noncontrast CT in another patient with strokelike symptoms demonstrates a hyperdense appearance of the right MCA with subtle loss of gray-white differentiation of the anterior right temporal lobe.
-
A follow-up noncontrast CT scan of the brain; this was obtained in the patient in the previous image and demonstrates diffuse hypodensity with loss of gray-white differentiation and sulcal effacement in most of the right middle cerebral artery (MCA) territory, with mass effect upon the left lateral ventricle and leftward midline shift consistent with an acute infarction.
-
Dense basilar artery: Axial noncontrast CT scan demonstrates a hyperdense basilar artery in a patient with pontine infarction who was later found to have basilar artery thrombosis. Other large vessels besides the middle cerebral artery (MCA) can produce a dense vessel sign when occluded.
-
Chronic infarction: Noncontrast CT scan demonstrates a well-defined area of volume loss in the right temporal lobe with a low-density appearance consistent with encephalomalacia. No mass effect exists.
-
Thrombolytic therapy carries a small but significant risk of life-threatening hemorrhage. For this reason, carefully screening for exclusionary criteria prior to administering tPA is important; this criteria includes hemorrhage, large areas of infarction, and patient presentation beyond the 3-hour window for IV tPA or possibly beyond 6 hours for IA tPA. This case illustrates this point in a patient with normal NCCT who was treated with IV tPA for acute stroke and, over the next 2 days, developed significant hemorrhage. Hemorrhage is noted to progressively increase in size along the medial margin of the right thalamus and the third ventricle. Obstructive hydrocephalus with hemorrhage layering is seen in the dependent portions of the occipital horns.
-
MIP and surface volume rendered images of the circle of Willis from a CTA in a 70-year-old female with acute onset right-sided weakness. A high-grade stenosis of the distal left middle cerebral artery (MCA) trunk (red circles) is seen, with filling of the remainder of the MCA territory via an anterior branch near the bifurcation.
-
CTA source data can also be useful to assess for areas of hypoperfusion and poor enhancement that may correspond to areas of greatest ischemia. This CTA source image from the patient in the previous case demonstrates significantly diminished enhancement involving the caudate head, lentiform nucleus, and capsular regions. High density noted centrally in this poorly enhancing region represents an area of hemorrhagic transformation.
-
Placement of ROI curves on arterial and venous pixels (image on right) are needed to generate time-concentration curves for perfusion imaging. These curves can then be used to generate perfusion maps.
-
After selecting the appropriate arterial and venous input functions, the computer software is able to generate perfusion maps of different parameters (CBF = cerebral blood flow, CBV = cerebral blood Volume, MTT = mean transit time, TTP = time to peak enhancement). Regions of interest can then be placed over these maps for quantitative information. In this patient with occlusion of the distal left MCA trunk, elevated MTT and diminished CBF exists in the left basal ganglia, insular and opercular regions. The CBV is mildly increased in this same region, which is believed to be due to autoregulatory vasodilation in response to ischemia.
-
Axial FLAIR image demonstrates intra-arterial high signal in the left middle cerebral artery (MCA) of this patient with early stroke. The intra-arterial high signal has been postulated to be secondary to different factors, including stasis, slow or reversed flow, and thrombus.
-
Noncontrast CT scan and MRI of the brain with DWI was performed to evaluate this 87-year-old male with history of recurrent strokes and new change in mental status. Noncontrast CT scan demonstrates a right PCA distribution hypodensity, and a hypodensity at the vertex on the right near the MCA/ACA borderzone. Both of these abnormalities are age indeterminate on the CT scan.
-
MRI was obtained to further clarify the findings on a noncontrast CT scan. High signal on the DWI and corresponding low signal on the ADC maps in the right frontal vertex borderzone area are seen. This signifies true restricted diffusion and an acute infarction.
-
The right posterior cerebral artery (PCA) distribution infarction is most likely chronic. The high signal on the DWI has no corresponding low signal on the ADC map (red circle). The ADC map demonstrates slightly elevated signal in this case. The falsely persistent high signal on DWI in the absence of recent infarction is felt to be related to the partial T2-effects of DWI and is referred to as "T2 shine through."
-
Axial T1-weighted postcontrast image obtained in a patient with recent stroke demonstrates arterial enhancement within the left middle cerebral artery (MCA) as well as cortical and subcortical enhancement in the adjacent insular and opercular regions. The arterial enhancement is believed to be due to slow flow and underlying impaired hemodynamics. Early parenchymal enhancement may indicate good collateral supply.
-
TOF MRA demonstrates an occlusion or high-grade stenosis at the mid to distal right middle cerebral artery (MCA) trunk. MRA is highly accurate at helping to evaluate large intracerebral vessel stenosis, although less reliable than CT scanning at helping to grade stenosis.
-
3D time-of-flight (TOF) of the neck axial and MIP images demonstrates a 2-cm low-signal curvilinear dissection flap in the mid right vertebral artery. This patient has a history of fibromuscular dysplasia and prior carotid artery dissection.
-
Left internal carotid artery (ICA) occlusion: Axial FLAIR images demonstrate high signal in the centrum semiovale in the deep borderzone region with corresponding restricted diffusion, indicating infarction. MIP from a time-of-flight MRA of the circle of Willis demonstrates no flow in the left ICA or anterior circulation on the right.
-
Left internal carotid artery (ICA) occlusion: MR perfusion imaging demonstrates global and marked elevation in mean transit time (image on left) in most of the left cerebral hemisphere, sparing only part of the posterior circulation. This demonstrates how MTT is extremely sensitive to abnormalities in perfusion. The CBV (image on right) is markedly depressed more centrally in the deep and subcortical white matter, consistent with the infarction noted on DWI.
-
Color Doppler ultrasound of the left internal carotid artery was obtained in a 57-year-old male with history of transient ischemic attacks. A large amount of plaque is seen in the proximal left internal carotid artery producing a high-grade stenosis. However, color flow is noted distal to the stenosis.
-
Pulsed Doppler waveforms in the same patient demonstrate a markedly elevated peak systolic velocity in the proximal internal carotid artery (ICA) of 252 cm/s. The second waveform, obtained more distally in the same stenosis, demonstrates a velocity of greater than 400 cm/s. The stenosis is more than 70 and, based on gray scale and color flow assessment, appears near occlusive. This illustrates the importance of carefully sampling along the course of a stenosis for the highest peak systolic velocity.
-
Digital subtraction angiogram performed in the same patient as previous photo confirms the near occlusion with a "string sign" in the proximal left internal carotid artery.
-
Transcranial Doppler demonstrates pulsatile flow in the right-middle cerebral artery in a 40-year-old patient following subarachnoid hemorrhage and vasospasm. At a depth of 58 mm (near the origin of the middle cerebral artery [MCA]), a markedly elevated peak systolic flow velocity of approximately 251 cm/s and a mean velocity of approximately 164 cm/s indicates severe MCA stenosis. Normal peak and mean MCA flow velocities are approximately 100 cm/s and 50 cm/s, respectively.
-
Noncontrast CT of the brain in a patient with history of remote CVA demonstrates low density in the right frontal and anterior temporal regions in the MCA distribution. Evidence of parenchymal volume loss with ex-vacuo dilatation of the right lateral ventricle is present, indicating chronicity infarction.
-
Noncontrast CT in this 52-year-old male with history of worsening right-sided weakness and apahasia demonstrates diffuse hypodensity and sulcal effacement involving the left anterior and middle cerebral artery territories consistent with acute infarction. Scattered curvilinear areas of hyperdensity are suggestive of developing petechial hemorrhage in this large area of infarction.
-
MRA in the same patient (left) demonstrates occlusion of the left precavernous supraclinoid internal carotid artery (ICA, red circle), occlusion or high-grade stenosis of the distal middle cerebral artery (MCA) trunk and attenuation of multiple M2 branches. The diffusion-weighted image (right) demonstrates high signal confirmed to be true restricted diffusion on the ADC map consistent with acute infarction.
-
Lateral view of a cerebral angiogram illustrates the branches of the anterior cerebral artery and Sylvian triangle. The pericallosal artery has been described to arise distal to the anterior communicating artery or distal to the the origin of the callosomarginal branch of the anterior cerebral artery (ACA). The segmental anatomy of the ACA has been described as follows: the A1 segment extends from the internal carotid artery (ICA) bifurcation to the anterior communicating artery; A2 extends to the junction of the rostrum and genu of the corpus callosum; A3 extends into the bend of the genu of the corpus callosum; A4 and A5 extend posteriorly above the callosal body and superior portion of the splenium. The Sylvian triangle overlies the opercular branches of the middle cerebral artery (MCA), with the apex representing the Sylvian point.
-
Frontal projection from a right vertebral artery angiogram illustrates the posterior circulation. The vertebral arteries join to form the basilar artery. The posterior inferior cerebellar arteries (PICA) arise from the distal vertebral arteries. The anterior inferior cerebellar arteries (AICA) arise from the proximal basilar artery. The superior cerebellar arteries (SICA) arise distally from the basilar artery prior to its bifurcation into the posterior cerebral arteries.
-
Frontal view of a cerebral angiogram with selective injection of the left internal carotid artery illustrates the anterior circulation. The anterior cerebral artery consists of the A1 segment proximal to the anterior communicating artery with the A2 segment distal to it. The MCA can be divided into 4 segments: the M1 (horizontal segment) extends to the limen insulae and gives off lateral lenticulostriate branches, the M2 (insular segment), M3 (opercular branches) and M4 (distal cortical branches on the lateral hemispheric convexities).
-
Frontal view from a cerebral angiogram in a 41-year-old male who presented 7 days prior with subarachnoid hemorrhage from a ruptured anterior communicating artery aneurysm treated with surgical clipping. Significant narrowing of the proximal left anterior cerebral artery (ACA), left M1 segment, and left supraclinoid internal carotid artery (ICA) indicates vasospasm.
-
Angiographic view in the same patient (image on left) with superimposed road map image demonstrate placement of a wire across the left M1 segment and balloon angioplasty. The left proximal anterior cerebral artery (ACA) and supraclinoid internal carotid artery (ICA) were also angioplastied and intra-arterial verapamil was administered. Follow-up image on the right after treatment demonstrates resolution of the left M1 segment and distal ICA, which are now widely patent. Residual narrowing is seen in the left proximal ACA.
-
Regions of interest are selected for arterial and venous input (image on left) for dynamic susceptibility-weighted perfusion MRI. Signal-time curves (image on right) obtained from these ROI demonstrate transient signal drop following the administration of intravenous contrast. The information obtained from the dynamic parenchymal signal changes post contrast are used to generate maps of different perfusion parameters.
-
Vascular distributions: Middle cerebral artery (MCA) infarction. Noncontrast CT scan demonstrates a large acute infarction in the MCA territory involving the lateral surfaces of the left frontal, parietal, and temporal lobes as well as the left insular and subinsular regions with mass effect and rightward midline shift. The caudate head is spared, and at least part of the lentiform nucleus and internal capsule, which receive blood supply form the lateral lenticulostriate branches of the M1 segment of the MCA. Note the lack of involvement of the medial frontal lobe (anterior cerebral artery territory), thalami and paramedian occipital lobe (posterior cerebral artery territory).
-
Vascular distributions: Anterior choroidal artery infarction. The diffusion-weighted image (left) demonstrates high signal with associated signal dropout on the apparent diffusion coefficient (ADC) map involving the posterior limb of the internal capsule. This is the typical distribution of the anterior choroidal artery, the last branch of the internal carotid artery before bifurcating into the anterior and middle cerebral arteries. The anterior choroidal artery may also arise from the middle cerebral artery (MCA).
-
Vascular distributions: anterior cerebral artery (ACA) infarction. Diffusion-weighted image on the left demonstrates high signal in the paramedian frontal and high parietal regions. The opposite diffusion-weighted image in a different patient demonstrates restricted diffusion in a larger ACA infarction involving the left paramedian frontal and posterior parietal regions. Infarction of the lateral temporoparietal regions bilaterally (both MCA distributions) also exists; it is greater on the left, indicating multivessel involvement suggesting emboli.
-
Vascular distributions: posterior cerebral artery (PCA) infarction. The noncontrast CT images demonstrate PCA distribution infarction involving the right occipital and inferomedial temporal lobes. The image on the right demonstrates additional involvement of the thalamus, also part of the PCA territory.
-
Cerebral angiogram was performed in a 57-year-old male with family history of subarachnoid hemorrhage and found on previous imaging to have a left distal internal carotid artery (ICA) aneurysm. The lateral projection from the angiogram demonstrates a narrow-necked aneurysm arising off the posterior aspect of the distal supraclinoid left ICA with an additional nipple-like projecting off the inferior aspect of the dome of the aneurysm. Mild lobulated dilatation of the cavernous left ICA is also present.
-
Follow-up cerebral angiogram in the same patient as previous image after coil embolization. Multiple coils were placed with sequential occlusion of the aneurysm, including the nipple at its inferior aspect. A small amount of residual filling is noted at the proximal neck of the aneurysm, which may thrombose over time.
-
The supratentorial vascular territories of the major cerebral arteries are demonstrated superimposed on axial (left) and coronal (right) T2-weighted images through the level of the basal ganglia and thalami. The middle cerebral artery (MCA; red) supplies the lateral aspects of the hemispheres, including the lateral frontal, parietal and anterior temporal lobes, insula, and basal ganglia. The anterior cerebral artery (ACA; blue) supplies the medial frontal and parietal lobes. The posterior cerebral artery (PCA; green) supplies the thalami and occipital and inferior temporal lobes. The anterior choroidal artery (yellow) supplies the posterior limb of the internal capsule and part of the hippocampus extending to the anterior and superior surface of the occipital horn of the lateral ventricle.
-
CT fogging effect: Axial noncontrast CT scan demonstrates focal low density, loss of gray-white differentiation, and mild sulcal effacement in the right parietal region (left image, arrow) in a 62-year-old female presenting with acute stroke. A follow-up noncontrast CT scan obtained 10 days later demonstrates diminished sulcal effacement and isodensity with a near-normal appearance (middle image), thought to be secondary to the CT "fogging effect" that may be seen during the evolution of an infarct. The axial diffusion-weighted image (right) confirms the right parietal infarct.
-
ASPECTS quantitative stroke scoring system: For ASPECTS scoring, the middle cerebral artery (MCA) territory is allotted 1 point for each of 10 separate regions: M1, M2, M3, M4, M5, M6, the caudate nucleus (C), lentiform nucleus (L), insular cortex (I), and internal capsule (IC). Scoring is based on a section at the level of the basal ganglia and thalami and another section above the level at the basal ganglia. One point is subtracted for each area demonstrating signs of early ischemic change, such as focal parenchymal hypoattenuation or edema. A normal scan would be scored a 10, and diffuse edema involving all points would be scored 0.
-
Noncontrast CT scan performed in a 60-year-old male who presented with acute stroke demonstrates the use of the ASPECTS. Diffuse hypodensity is noted throughout the middle cerebral artery (MCA) distribution involving the M1-M6 regions and insula. Seven points are then subtracting from the 10-point ASPECTS, yielding a score of 3. C = caudate nucleus, L = lentiform nucleus, I = insular cortex, and IC = internal capsule.


