
Glycemic Index Values of Pasta Products: An Overview
by
 , , and
Giuseppe Di Pede
1 ,
,
Rossella Dodi
1,
Cecilia Scarpa
1,
Furio Brighenti
1,
Margherita Dall’Asta
2 and
Francesca Scazzina
1,* 1
Department of Food and Drug, University of Parma, Via Volturno 39, 43124 Parma, Italy
2
Department of Animal Science, Food and Nutrition (DiANA), Università Cattolica del Sacro Cuore, Via Parmense 84, 29122 Piacenza, Italy
*
Author to whom correspondence should be addressed.
Foods 2021, 10(11), 2541; https://doi.org/10.3390/foods10112541
Submission received: 28 August 2021
/
Revised: 18 October 2021
/
Accepted: 19 October 2021
/
Published: 22 October 2021
(This article belongs to the Special Issue Durum Wheat Products - Recent Advances)
Abstract
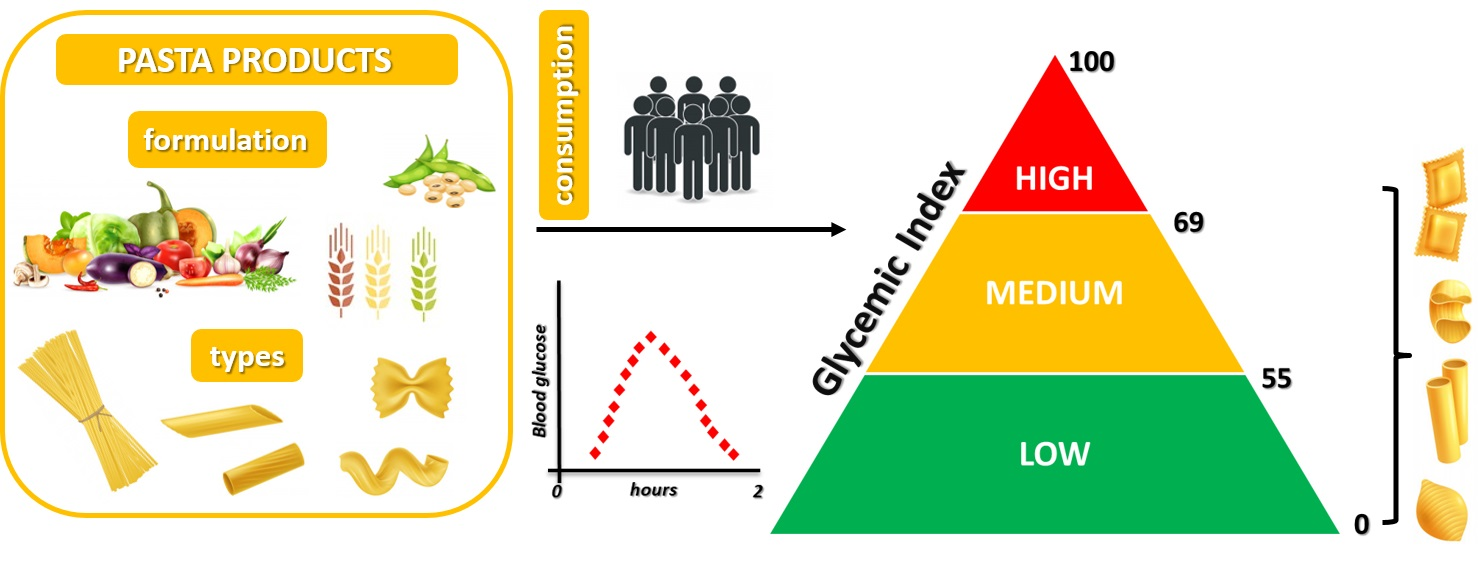
:Durum wheat pasta is considered a low-glycemic index (GI) food. In recent years, the interest in developing enriched pasta has increased. Since both the formulation and processing technologies may affect the GI, this study aimed to investigate the GI values of pasta products (pp) reported in the literature until 2020. GI values of pp analyzed following the ISO guidelines were included in this survey. A total of 95 pp were identified and, according to their formulation, classified into 10 categories (n, mean GI): category n 1: 100% refined wheat (35, 55); category n 2: 100% whole wheat (6, 52); category n 3: other cereal-based products (8, 52); category n 4: containing egg (5, 52); category n 5: gluten free (11, 60); category n 6: containing legumes (9, 46); category n 7: noodles and vermicelli (9, 56); category n 8: containing vegetable or algae (6, 51); category n 9: containing other ingredients (5, 37); category n 10: stuffed (1, 58). Overall, pasta is confirmed to be a medium–low-GI food, even if a high variability among or within each category emerged. The formulation of enriched pp able to elicit a controlled glycemic response could represent a strategy to improve the nutritional value of pasta.
Keywords:
pasta; glycemic index; enrichment; carbohydrate; ingredient; database; formulation; quality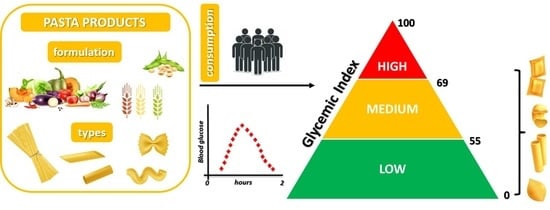
1. Introduction
Cereals, tubers and pulses are the main dietary sources of carbohydrates within the human diet [1], which are well known as the main dietary components affecting postprandial blood glucose levels [2,3,4]. The glycemic index (GI), proposed by Jenkins [5], is a tool for quantifying the relative rise in blood glucose level after consuming a carbohydrate-containing food. The GI is defined as the incremental area under the two-hour blood glucose response curve (IAUC) after ingestion of a food with a certain amount of available carbohydrates, expressed as a percentage of the IAUC after consumption of a standard meal in an iso-glucidic portion [5,6]. Pasta, a traditional food item within the Italian diet, is now globally consumed, becoming an important source of complex carbohydrates (i.e., starch) in many countries [7,8]. Since durum wheat pasta is produced by mixing semolina with water and with energy input [9], its nutritional properties are prevalently linked to its matrix structure formed during the extrusion and drying processes [10,11,12]. As a consequence of this technological process, the microstructure of pasta is compact and relatively dense, limiting the hydrolysis of internal starch granules, which explains its richness in slow digestible starch and its reduced enzymatic susceptibility during digestion [9,12]. Postprandial studies conducted in both healthy and diabetic volunteers confirmed that durum wheat pasta induced a lower postprandial glucose response than other wheat-based products (i.e., bread) by virtue of its compact dense physical structure (dried pasta) and the network of gluten surrounding the starch granules [13,14,15,16]. On the other hand, refined wheat pasta is significantly lower in fiber and micronutrients (i.e., minerals and vitamins) with respect to whole grain pasta [9], and it is well known that the biological value of wheat proteins is low due to the deficiency in some essential amino acids, such as lysine and threonine [17]. Due to the importance and role of pasta as one of the main staple foods in the human diet, the interest in developing enriched pasta with high nutritional values has grown [18,19,20,21,22]. To achieve this goal, different approaches have been developed, as pasta could be used as dietary carrier of macronutrients, vitamins, minerals and/or phytochemicals by adding legumes, flour from vegetables/marine foods, and flour of refined or whole cereals different from wheat [19,20,23,24,25] (Figure 1).
Within the context of enriched pasta, functional ingredients can be added, as functional food consumption has increased in recent years [26,27]. Their consumption, by virtue of their physiologically active components, should provide health benefits beyond basic nutrition [28]. Since pasta formulation could affect the glycemic response after consumption, and therefore, its GI, beyond the processing method [29,30,31], a large number of human intervention studies have investigated the GI of enriched pasta products [18,21,32,33,34]. Thus, since the GI represents one of the most important parameters considered for evaluating the quality of dietary carbohydrates, this study aimed to gather the GI values of pasta products (pp) published in the literature until 2020.
2. Materials and Methods
2.1. Data Collection
A literature search to collect data on GI values of pp published in the literature without any restrictions was performed in December 2020 by using Pubmed, Scopus, Web of Science and Science Direct. Keywords used for data collection were: “glyc(a)emic index” AND pasta. Taking into consideration the ISO guidelines [35] for GI determination, exclusion criteria for data collection were as follows: (I) GI values obtained in the context of mixed meals or with the addition of any condiments; (II) GI values obtained using a sample size of less than ten subjects, and/or unhealthy subjects; (III) GI values calculated by using a standard meal other than glucose solution or white bread; (IV) GI values calculated considering IAUCs obtained before or after two postprandial hours following pasta consumption; (V) human intervention studies not specifying the number of subjects enrolled and/or the standard meal used; (VI) GI values calculated using in vitro models (i.e., estimated GI).
2.2. Database Development
Data on (i) pasta characteristics (types and formulation), (ii) GI values (mean value and data distribution expressed as standard deviation (SD) or standard error of the mean (SEM)), and (iii) experimental protocol for GI measurement (blood sample, sample size, standard meal, available carbohydrate (Av. CHO)/portion in grams, and place of analysis) were collected from research papers that met the inclusion criteria. According to their formulation, pp were classified into ten categories: (category n 1) 100% refined wheat; (category n 2) 100% whole wheat; (category n 3) other cereal-based products; (category n 4) containing egg; (category n 5) gluten free (GF); (category n 6) containing legumes; (category n 7) noodles and vermicelli; (category n 8) containing vegetable or algae; (category n 9) containing other ingredients; (category n 10) stuffed. Furthermore, pp within the same category were further subdivided into ‘Low’ GI (0 ≥ GI ≤ 55), ‘Medium’ GI (55 > GI ≤ 70), and ‘High’ GI (70 > GI ≤ 100) [5,35].
2.3. Data Analysis
The normality of data distribution within each category was verified through the Kolmogorov–Smirnov test, and GI values for the 10 categories of pp were expressed as the mean. The number of items at low, medium and high GI was provided as a percentage value with respect to the total number of pp within each category (data distribution). The statistical analysis was carried out using SPSS software (IBM SPSS Statistics, Version 25.0, IBM Corp., Chicago, IL, USA).
3. Results
3.1. GI Data
GI values of 95 pp were gathered from 28 research articles and are reported in Table 1. Category n 1 (100% refined wheat) was the largest group, including 35 items, among which six values were collected for 100% whole wheat pasta (category n 2), eight for other cereal-based products (category n 3), five for egg pasta (category n 4), 11 for GF (category n 5), nine for products containing legume (category n 6), nine for noodles and vermicelli (category n 7), six for pasta containing vegetable or algae (category n 8), five for items containing other ingredients (category n 9), and only one for stuffed pasta (category n 10). As reported in Figure 2, the GI of pp belonging to the same category are highly variable. Low-GI pastas were present in all the investigated categories, with the only exception of category n 10 (stuffed pp). No data on medium GI food items were recovered for products containing egg and containing other ingredients (categories n 4 and n 9, respectively). Conversely, high GI pastas fell within the 100% refined wheat pasta (category n 1), other cereal-based products (category n 3), GF pasta (category n 5) categories, and within products containing legumes (category n 6).
According to the GI classification rank (http://www.glycemicindex.com, accessed on 20 July 2021), pp belonging to categories n 1 (100% refined wheat), n 2 (100% whole wheat), n 3 (other cereal-based products), n 4 (containing egg), n 6 (containing legumes), n 8 (containing vegetable or algae), and n 9 (containing other ingredient) can be classified as low-GI foods. Items belonging to categories n 5 (gluten free), n 7 (noodles and vermicelli) and n 10 (stuffed) had a medium GI.
3.2. Formulations
Flours from barley and emmer were the main flours employed to produce pp with other cereals (category n 3), followed by spelt and Kamut® flours. GF items (category n 5) were formulated using GF cereal flours (rice, corn, and millet) and adding legumes (chickpea, soy), or modified starches (high amylose or resistant maltodextrin). Among the items containing legumes (category n 6), only three were formulated with 100% legume flour (red lentil, pea, and soy), while the remaining products were produced through a combination of legume (faba bean, chickpea, and whole yellow pea) and durum wheat flour, or by mixing different legume flours (i.e., grass pea and chickpea flours). Flours from wheat, rice, corn, or tubers (i.e., tapioca) were raw materials used for the formulation of noodles and vermicelli (category n 7). Pulps from carrot, pumpkin, tomato, zucchini and spinach were used for pasta containing vegetable formulations, while only one algae flour type (Eucheuma cottonii), added at different percentages (7%, 14%, and 21%), was used for pasta containing algae production (category n 8). Items containing protein, starchy ingredients (amylose and resistant starch) or fiber (Barley Balance®, psyllium seed husk) were included in category n 9 (containing other ingredients).
3.3. Experimental Protocol Data
A total of 71 GI values (equal to 75% of the total GI values) were obtained from capillary blood with respect to venous blood (used for 4% of the total GI values), and in the remaining studies, this information was not available. A total of 74 GI values (78% of the total GI values) were calculated with a sample size of 10 subjects. Glucose solution as a standard meal was used for the determination of 76 GI values (80% of the total GI values). For 73 GI values, the amount of available carbohydrates (Av. CHO) contained for each portion of pasta was 50.0 g, while for 16 GI values, the Av. CHO content in pasta portion size ranged from 22.0 g to 49.0 g; no data were available for the six remaining products. Italy was the place of analyses for 42 GI values (equal to 44% of the total GI values), while a great heterogeneity emerged for the remaining items.
4. Discussion
This study aimed to develop a database of GI values of pp based on the collection of the data recently reported in the literature. To the best of our knowledge, this is the first database specifically designed for reporting all GI data on pp, even if several databases on GI values, calculated either in healthy or diabetic patients, of a wide range of food items, have been proposed [37,40,45,57,58,59,60]. High-GI foods elicit higher postprandial glycemic responses, which have been associated with several chronic diseases, among which type 2 diabetes [61,62], cancer [2,63], and cardiovascular diseases [3,61] are the most relevant. Hence, since low-GI food consumption was associated with weight reduction and decreased incidence of several pathological conditions [3,4,6,61,64,65], the adherence to low-GI dietary patterns is strongly recommended by several national guidelines aiming at cardiovascular disease and diabetes prevention worldwide [66,67,68,69,70]. The present work confirmed that the GI of refined wheat pasta is low, even if a relevant variability was observed among GI values belonging to category n 1 (100% refined wheat). Indeed, among GI values gathered for category n 1, 60% of them were low (n = 21), followed by items of medium and high GI (29% (n = 10) and 11% (n = 4) for 100% refined wheat pastas at medium and high GI, respectively). The physical structure of the gluten matrix, formed by durum wheat starch and wheat proteins, is the main intrinsic factor supposed to explain the lower glycemic response of 100% refined wheat pasta products with respect to other products prepared with refined wheat [10,11,12,13,71]. In fact, it is well established that wheat pasta may elicit a lower postprandial glycemic response compared with bread or potatoes in both healthy and diabetic subjects [11,13,14,72,73]. The presence of high-GI pp among those belonging to category n 1 could have been probably linked to a different area of production [18,19,33,51], which reflects a certain heterogeneity in both pasta formulation and processing technology. The 100% whole wheat items (category n 2) had prevalently low GI, confirming the tendency of wheat fiber to positively modulate postprandial glycemic excursions [74]. It seems that the overall concept of the low GI of durum wheat pasta should be contextualized with the raw materials (common or durum wheat, refined or whole wheat), their origin, and the technological process used to produce it, rather than with the experimental conditions (i.e., sample size, characteristics and dietary patterns of the enrolled subjects, and inter-day variability) applied throughout the study. Despite pp belonging to category n 3 were classified as low-GI foods, it should be noted that pp formulated with whole barley flours resulted in high GI, probably due to a weaker food structure by virtue of the higher amount of insoluble fiber in whole barley [51]. Further human intervention studies are needed to fully clarify the influence of using other cereals (both in their refined and whole version) on the GI of pasta. It is well known that food formulation, as well as processing technologies, has been recognized as the most important factors affecting the GI of food products [29,30,31,75]. In the present work, enriched pp were classified into seven categories, reflecting the high variety of raw materials employed throughout the technological processing to enrich them. Nowadays, several food production/formulation strategies are implemented to enrich pasta by improving its nutritional [20,76,77,78], technological [79,80,81,82] and sensorial attributes [83,84,85,86,87]. Moreover, both nutritional and health claims could be obtained following food enrichment [88], positively affecting consumer choices [89,90,91,92]. Egg pp samples (category n 4) had a low GI by virtue of egg macronutrients, such as protein and lipids, which may mediate a reduction in the glycemic excursion [93]. Considering all the samples included in the enriched pp categories (from categories n 4 to n 10), 29 items (equal to 63% of the total enriched pp) were categorized as low GI, while the remaining 14 and 3 pp were medium and high GI, respectively (equal to 30% and 7% of the total enriched pp for those at medium and high GI, respectively). Based on these results, it is clear that enriched pasta also tends to maintain a food matrix able to make starch poorly accessible to the enzymatic activity within the gastro-intestinal tract. On the other hand, it should be considered that some raw materials added for pasta enrichment might negatively influence its GI. Among pp belonging to categories n 5 and n 7 (GF, noodles and vermicelli, respectively), a high heterogeneity in GI values for items formulated from the same starchy source (i.e., rice and corn) emerged. In this case, the absence of further details concerning both the composition and the technological processes employed for both GF and noodle and vermicelli production limits any exhaustive conclusions on the link between a product’s characteristics and its GI. Furthermore, 78% of the total legume pp (category n 6) were categorized as low-GI items. Legumes are low-GI components of the Mediterranean diet by virtue of their nutritional properties (i.e., richness in protein and low digestible starch) [94,95,96]. Similarly, 67% of pp belonging to category n 8 (containing vegetable or algae) were also low GI. If vegetables are cooked or dressed with healthful oils, they could be considered important low-GI foods within our diet [97]. On the other hand, algae are recognized for their capacity to modulate glycemic response possibly thanks to the richness in bioactive compounds able to modulate glucose absorption and disposal [98]. As reported in Table 1, it should be presumed that both soluble fiber and modified starches or protein did not affect the food matrix structure and, consequently, carbohydrate bioavailability of pastas. Indeed, 100% of the items belonging to category n 9 were low GI. Dietary fiber, hydrocolloids, resistant starches and proteins have been shown to be able to slow the carbohydrate digestion rate [99,100]. Especially for other cereal-based items (category n 3), for GF pp (category n 5), and for those containing legumes (category n 6), GI values belonging to the same category were highly variable, reflecting the putative role of food properties [29,31,101], technological processing methods [14,15,20,54,102] and cooking time [12,31,103,104] in affecting carbohydrate bioavailability for pp, which could appear similar. Furthermore, since GI data for similar pp were presented as mean values and were collected from different human studies, the possible inter-individual variability in carbohydrate metabolism should also be taken into account [31,101,105,106]. The same factors may explain the variability observed among items belonging to different categories, which were not comparable. Similar pp (i.e., in terms of type, size, and shape) have different GI, since they could have been formulated by different brands or food factories and by means of several different raw materials (i.e., non-local flours) or a variety of technological methods. This variability could be greater for foods prepared to be sold in different national markets, given that the same product could be formulated depending on the country in which it will be commercialized [19]. We collected pp without any condiment added to avoid any confounding factors, since their role in modifying the glycemic excursion was clearly demonstrated [39,107,108,109]. Finally, both data on pasta formulation or regarding the experimental protocol employed for GI measurement were not always available, representing a limitation of the present study and proving the need for well-designed studies. The lack of data for some categories limits the conclusions for a clear relation between pasta formulation and GI value.
5. Conclusions and Future Perspectives
Overall, pasta is confirmed to be a medium–low-GI food. The present database would be a useful tool for pasta producers to formulate enriched pp with a high nutritional value. In fact, pasta with a high nutritional value and a low GI should be the industrial target, also keeping in mind specific consumer categories (e.g., celiac disease or type 2 diabetes patients). The observed variability for GI values of pp belonging to the same category, and to different categories, proves the inevitable role of formulation in influencing the GI of pasta, one of the most consumed starchy foods in our diet. Further human intervention studies are needed to obtain a clearer picture of this relationship.
Author Contributions
Conceptualization, G.D.P. and F.S.; methodology, G.D.P., R.D. and C.S.; investigation, G.D.P., M.D. and F.S.; data curation, G.D.P., R.D., C.S. and M.D.; writing—original draft preparation, G.D.P. and R.D.; writing—review and editing, G.D.P., F.B., M.D. and F.S.; supervision, M.D. and F.S. All authors have read and agreed to the published version of the manuscript.
Funding
This research received no external funding.
Conflicts of Interest
The authors declare no conflict of interest.
References
- FAO. Food Outlook-Biannual Report on Global Food Markets; FAO: Rome, Italy, 2017; ISBN 9789251097823. [Google Scholar]
- Blaak, E.E.; Antoine, J.-M.; Benton, D.; Björck, I.; Bozzetto, L.; Brouns, F.; Diamant, M.; Dye, L.; Hulshof, T.; Holst, J.J.; et al. Impact of Postprandial Glycaemia on Health and Prevention of Disease. Obes. Rev. 2012, 13, 923–984. [Google Scholar] [CrossRef]
- Ludwig, D.S. the Glycemic Index: Physiological Mechanisms Relating to Obesity, Diabetes, and Cardiovascular Disease. J. Am. Med. Assoc. 2002, 287, 2414–2423. [Google Scholar] [CrossRef]
- Ludwig, D.S.; Hu, F.B.; Tappy, L.; Brand-Miller, J. Dietary Carbohydrates: Role of Quality and Quantity in Chronic Disease. BMJ 2018, 361, k2340. [Google Scholar] [CrossRef] [Green Version]
- Jenkins, D.J.; Wolever, T.M.; Taylor, R.H.; Barker, H.; Fielden, H.; Baldwin, J.M.; Bowling, A.C.; Newman, H.C.; Jenkins, A.L.; Goff, D. V Glycemic Index of Foods: A Physiological Basis for Carbohydrate Exchange. Am. J. Clin. Nutr. 1981, 34, 362–366. [Google Scholar] [CrossRef] [Green Version]
- Willett, W.; Manson, J.; Liu, S. Glycemic Index, Glycemic Load, and Risk of Type 2 Diabetes. Am. J. Clin. Nutr. 2002, 76, 274S–280S. [Google Scholar] [CrossRef] [Green Version]
- Mastorakou, D.; Rabaeus, M.; Salen, P.; Pounis, G.; De, L.M. Mediterranean Diet: A Health-Protective Dietary Pattern for Modern Times; Elsevier Inc.: Amsterdam, The Netherlands, 2019; ISBN 9780128145562. [Google Scholar]
- International Pasta Organisation (IPO). The World Pasta Industry Status Report; International Pasta Organization: Rome, Italy, 2019; Available online: Http://Www.Internationalpasta.Org (accessed on 25 April 2021).
- Giacco, R.; Vitale, M.; Riccardi, G. Pasta: Role in Diet. In Encyclopedia of Food and Health; Elsevier Inc.: Amsterdam, The Netherlands, 2016; pp. 242–245. ISBN 9780123849533. [Google Scholar]
- Colonna, P.; Barry, J.-L.; Cloarec, D.; Bornet, F.; Gouilloud, S.; Galmiche, J.-P. Enzymic Susceptibility of Starch From Pasta. J. Cereal Sci. 1990, 11, 59–70. [Google Scholar] [CrossRef] [Green Version]
- Granfeldt, Y.; Björck, I. Glycemic Response to Starch in Pasta: A Study of Mechanisms of Limited Enzyme Availability. J. Cereal Sci. 1991, 14, 47–61. [Google Scholar] [CrossRef]
- Petitot, M.; Abecassis, J.; Micard, V. Structuring of Pasta Components during Processing: Impact on Starch and Protein Digestibility and Allergenicity. Trends Food Sci. Technol. 2009, 20, 521–532. [Google Scholar] [CrossRef]
- Granfeldt, Y.; Bjorck, I.; Hagander, B. on the Importance of Processing Conditions, Product Thickness and Egg Addition for the Glycaemic and Hormonal Responses to Pasta: A Comparison with Bread Made from “Pasta Ingredients”. Eur. J. Clin. Nutr. 1991, 45, 489–499. [Google Scholar]
- Jenkins, D.J.A.; Wolever, T.M.S.; Jenkins, A.L.; Lee, R.; Wong, G.S.; Josse, R. Glycemic Response to Wheat Products: Reduced Response to Pasta But No Effect of Fiber. Diabetes Care 1983, 6, 155–159. [Google Scholar] [CrossRef]
- Wolever, T.M.S.; Jenkins, D.J.A.; Kalmusky, J.; Giordano, C.; Giudici, S.; Thompson, L.U.; Wong, G.S.; Josse, R.G. Glycemic Response to Pasta: Effect of Surface Area, Degree of Cooking, and Protein Enrichment. Diabetes Care 1986, 9, 401–404. [Google Scholar] [CrossRef]
- Zou, W.; Sissons, M.; Gidley, M.J.; Gilbert, R.G.; Warren, F.J. Combined Techniques for Characterising Pasta Structure Reveals How the Gluten Network Slows Enzymic Digestion Rate. Food Chem. 2015, 188, 559–568. [Google Scholar] [CrossRef] [Green Version]
- Abdel-Aal, E.S.M.; Hucl, P. Amino Acid Composition and in Vitro Protein Digestibility of Selected Ancient Wheats and their End Products. J. Food Compos. Anal. 2002, 15, 737–747. [Google Scholar] [CrossRef]
- Firdaus, M.; Yahya; Nugraha, G.R.H.; Utari, D.D. Fortification of Seaweed (Eucheuma Cottonii) Flour on Nutrition, Iodine, and Glycemic Index of Pasta. In The IOP Conference Series: Earth and Environmental Science; Institute of Physics Publishing: Bristol, UK, 2017; Volume 89. [Google Scholar]
- Goñi, I.; Valentín-Gamazo, C. Chickpea Flour Ingredient Slows Glycemic Response to Pasta in Healthy Volunteers. Food Chem. 2003, 81, 511–515. [Google Scholar] [CrossRef]
- Oliviero, T.; Fogliano, V. Food Design Strategies to Increase Vegetable Intake: The Case of Vegetable Enriched Pasta. Trends Food Sci. Technol. 2016, 51, 58–64. [Google Scholar] [CrossRef]
- Turco, I.; Bacchetti, T.; Morresi, C.; Padalino, L.; Ferretti, G. Polyphenols and the Glycaemic Index of Legume Pasta. Food Funct. 2019, 10, 5931–5938. [Google Scholar] [CrossRef]
- Wahanik, A.L.; Chang, Y.K.; Clerici, M.T.P.S. How to Make Pastas Healthier? Food Rev. Int. 2018, 34, 52–69. [Google Scholar] [CrossRef]
- Aravind, N.; Sissons, M.; Fellows, C.M. Effect of Soluble Fibre (Guar Gum and Carboxymethylcellulose) Addition on Technological, Sensory and Structural Properties of Durum Wheat Spaghetti. Food Chem. 2012, 131, 893–900. [Google Scholar] [CrossRef]
- Gallegos-Infante, J.-A.; Bello-Perez, L.A.; Rocha-Guzman, N.E.; Gonzalez-Laredo, R.F.; Avila-ontiveros, M. Effect of the Addition of Common Bean (Phaseolus Vulgaris L.) Flour on the in Vitro Digestibility of Starch and Undigestible Carbohydrates in Spaghetti. J. Food Sci. 2010, 75, 151–156. [Google Scholar] [CrossRef]
- Khan, I.; Yousif, A.; Johnson, S.K.; Gamlath, S. Effect of Sorghum Flour Addition on Resistant Starch Content, Phenolic Profile and Antioxidant Capacity of Durum Wheat Pasta. Food Res. Int. 2013, 54, 578–586. [Google Scholar] [CrossRef] [Green Version]
- Bogue, J.; Collins, O.; Troy, A.J. Market Analysis and Concept Development of Functional Foods. In Developing New Functional Food and Nutraceutical Products; Elsevier Inc.: Amsterdam, The Netherlands, 2017; pp. 29–45. ISBN 9780128027790. [Google Scholar]
- Karelakis, C.; Zevgitis, P.; Galanopoulos, K.; Mattas, K. Consumer Trends and Attitudes to Functional Foods. J. Int. Food Agribus. Mark. 2020, 32, 266–294. [Google Scholar] [CrossRef]
- Chavez-Gonzalez, M.L.; Buenrostro-Figueroa, J.J.; Aguilar, C.N. Handbook of Research on Food Science and Technology: Volume 3: Functional Foods and Nutraceuticals; Apple Academic Press: Palm Bay, FL, USA, 2021; ISBN 9781774635308. [Google Scholar]
- Björck, I.; Granfeldt, Y.; Liljeberg, H.; Tovar, J.; Asp, N.G. Food Properties Affecting the Digestion and Absorption of Carbohydrates. Am. J. Clin. Nutr. 1994, 59, 699s–705s. [Google Scholar] [CrossRef]
- Brand, J.C.; Nicholson, P.L.; Thorburn, A.W.; Truswell, A.S.; Brand, C.; Nicholson, L. Food Processing and the Glycemic Index. Am. J. Clin. Nutr. 1985, 42, 1192–1196. [Google Scholar] [CrossRef]
- Englyst, K.N.; Englyst, H.N. Carbohydrate Bioavailability. Br. J. Nutr. 2005, 94, 1–11. [Google Scholar] [CrossRef]
- Blair, R.M.; Henley, E.C.; Tabor, A. Soy Foods Have Low Glycemic and Insulin Response Indices in Normal Weight Subjects. Nutr. J. 2006, 5, 35. [Google Scholar] [CrossRef] [Green Version]
- Marinangeli, C.P.F.; Kassis, A.N.; Jones, P.J.H. Glycemic Responses and Sensory Characteristics of Whole Yellow Pea Flour Added to Novel Functional Foods. J. Food Sci. 2009, 74, S385–S389. [Google Scholar] [CrossRef]
- Scazzina, F.; Dall’asta, M.; Pellegrini, N.; Brighenti, F. Glycaemic Index of Some Commercial Gluten-Free Foods. Eur. J. Nutr. 2015, 54, 1021–1026. [Google Scholar] [CrossRef]
- International Standards Organisation. Food Products Determination of the Glycaemic Index (Gi) and Recommendation for Food Classification; International Standards Organisation: Geneva, Switzerland, 2010; ISO 26642. [Google Scholar]
- Fares, C.; Codianni, P.; Nigro, F.; Platani, C.; Scazzina, F.; Pellegrini, N. Processing and Cooking Effects on Chemical, Nutritional and Functional Properties of Pasta Obtained From Selected Emmer Genotypes. J. Sci. Food Agric. 2008, 88, 2435–2444. [Google Scholar] [CrossRef]
- Scazzina, F.; Dall’asta, M.; Casiraghi, M.C.; Sieri, S.; Del Rio, D.; Pellegrini, N.; Brighenti, F. Glycemic Index and Glycemic Load of Commercial Italian Foods. Nutr. Metab. Cardiovasc. Dis. 2016, 26, 419–429. [Google Scholar] [CrossRef]
- Wolever, T.M.S.; Vorster, H.H.; Björck, I.; Brand-Miller, J.; Brighenti, F.; Mann, J.I.; Ramdath, D.D.; Granfeldt, Y.; Holt, S.; Perry, T.L.; et al. Determination of the Glycaemic Index of Foods: Interlaboratory Study. Eur. J. Clin. Nutr. 2003, 57, 475–482. [Google Scholar] [CrossRef] [Green Version]
- Chiavaroli, L.; Di Pede, G.; Dall’asta, M.; Cossu, M.; Francinelli, V.; Goldoni, M.; Scazzina, F.; Brighenti, F. the Importance of Glycemic Index on Post-Prandial Glycaemia in the Context of Mixed Meals: A Randomized Controlled Trial on Pasta and Rice. Nutr. Metab. Cardiovasc. Dis. 2020, 31, 615–625. [Google Scholar] [CrossRef]
- Atkinson, F.S.; Foster-Powell, K.; Brand-Miller, J.C. International Tables of Glycemic Index and Glycemic Load Values: 2008. Diabetes Care 2008, 31, 2281–2283. [Google Scholar] [CrossRef] [Green Version]
- Hajifaraji, M.; Rezvani, V.; Yaghoobi, A.S.; Morteza, H.; Maddah, M. Glycemic Indices of Three Commonly Consumed Foods: A Clinical Trial in Iranian Healthy Adults. Med. J. Nutr. Metab. 2012, 5, 253–257. [Google Scholar] [CrossRef]
- Sissons, M.; Sestili, F.; Botticella, E.; Masci, S.; Lafiandra, D. Can Manipulation of Durum Wheat Amylose Content Reduce the Glycaemic Index of Spaghetti? Foods 2020, 9, 693. [Google Scholar] [CrossRef]
- Peressini, D.; Cavarape, A.; Brennan, M.A.; Gao, J.; Brennan, C.S. Viscoelastic Properties of Durum Wheat Doughs Enriched with Soluble Dietary Fibres in Relation to Pasta-Making Performance and Glycaemic Response of Spaghetti. Food Hydrocoll. 2020, 102, 105613. [Google Scholar] [CrossRef]
- Greffeuille, V.; Marsset-Baglieri, A.; Molinari, N.; Cassan, D.; Sutra, T.; Avignon, A.; Micard, V. Enrichment of Pasta with Faba Bean Does Not Impact Glycemic or Insulin Response But Can Enhance Satiety Feeling and Digestive Comfort When Dried at Very High Temperature. Food Funct. 2015, 6, 2996–3005. [Google Scholar] [CrossRef]
- Henry, C.J.K.; Lightowler, H.J.; Strik, C.M.; Renton, H.; Hails, S. Glycaemic Index and Glycaemic Load Values of Commercially Available Products in the Uk. Br. J. Nutr. 2005, 94, 922–930. [Google Scholar] [CrossRef] [Green Version]
- Simonato, B.; Curioni, A.; Pasini, G. Digestibility of Pasta Made with Three Wheat Types: A Preliminary Study. Food Chem. 2015, 174, 219–225. [Google Scholar] [CrossRef]
- Granfeldt, Y.; Wu, X.; Björck, I. Determination of Glycaemic Index; Some Methodological Aspects Related to the Analysis of Carbohydrate Load and Characteristics of the Previous Evening Meal. Eur. J. Clin. Nutr. 2006, 60, 104–112. [Google Scholar] [CrossRef] [Green Version]
- Fujiwara, N.; Hall, C.; Jenkins, A.L. Development of Low Glycemic Index (Gi) Foods By Incorporating Pulse Ingredients Into Cereal-Based Products: Use of in Vitro Screening and in Vivo Methodologies. Cereal Chem. J. 2017, 94, 110–116. [Google Scholar] [CrossRef]
- Henry, C.J.K.K.; Lightowler, H.J.; Kendall, F.L.; Storey, M. the Impact of the Addition of toppings/Fillings on the Glycaemic Response to Commonly Consumed Carbohydrate Foods. Eur. J. Clin. Nutr. 2006, 60, 763–769. [Google Scholar] [CrossRef]
- Carreira, M.C.; Lajolo, F.M.; De Menezes, E.W. Glycemic Index: Effect of Food Storage Under Low Temperature. Braz. Arch. Biol. Technol. 2004, 47, 569–574. [Google Scholar] [CrossRef]
- Aldughpassi, A.; Abdel-Aal, E.-S.M.; Wolever, T.M.S. The Journal of Nutrition Nutrient Physiology, Metabolism, and Nutrient-Nutrient Interactions Barley Cultivar, Kernel Composition, and Processing Affect the Glycemic Index 1-3. J. Nutr. 2012, 142, 1666–1671. [Google Scholar] [CrossRef] [Green Version]
- Perry, T.; Mann, J.; Mehalski, K.; Gayya, C.; Wilson, J.; Thompson, C. Glycaemic Index of New Zealand Foods. N. Z. Med. J. 2000, 113, 140–142. [Google Scholar]
- Aston, L.M.; Gambell, J.M.; Lee, D.M.; Bryant, S.P.; Jebb, S.A. Determination of the Glycaemic Index of Various Staple Carbohydrate-Rich Foods in the UK Diet. Eur. J. Clin. Nutr. 2008, 62, 279–285. [Google Scholar] [CrossRef] [Green Version]
- Barbiroli, A.; Bonomi, F.; Casiraghi, M.C.; Iametti, S.; Pagani, M.A.; Marti, A. Process Conditions Affect Starch Structure and Its Interactions with Proteins in Rice Pasta. Carbohydr. Polym. 2013, 92, 1865–1872. [Google Scholar] [CrossRef]
- Shobana, S.; Selvi, R.P.; Kavitha, V.; Gayathri, N.; Geetha, G.; Gayathri, R.; Vijayalakshmi, P.; Balasubramaniam, K.K.G.; Ruchi, V.; Sudha, V.; et al. Development and Evaluation of Nutritional, Sensory and Glycemic Properties of Finger Millet (Eleusine Coracana L.) Based Food Products. Asia Pac. J. Clin. Nutr. 2018, 27, 84–91. [Google Scholar] [CrossRef]
- Yang, Y.X.; Wang, H.W.; Cui, H.M.; Wang, Y.; Yu, L.D.; Xiang, S.X.; Zhou, S.Y. Glycemic Index of Cereals and Tubers Produced in China. World J. Gastroenterol. 2006, 12, 3430–3433. [Google Scholar] [CrossRef]
- Lok, K.Y.; Chan, R.; Chan, D.; Li, L.; Leung, G.; Woo, J.; Lightowler, H.J.; Henry, C.J.K. Glycaemic Index and Glycaemic Load Values of a Selection of Popular Foods Consumed in Hong Kong. Br. J. Nutr. 2010, 103, 556–560. [Google Scholar] [CrossRef]
- Foster-Powell, K.; Holt, S.H.; Brand-Miller, J.C. International Table of Glycemic Index and Glycemic Load Values: 2002. Am. J. Clin. Nutr. 2002, 76, 5–56. [Google Scholar] [CrossRef] [Green Version]
- Foster-Powell, K.; Miller, J.B. International Tables of Glycemic Index. Am. J. Clin. Nutr. 1995, 62, 871s–890s. [Google Scholar] [CrossRef]
- Atkinson, F.S.; Brand-Miller, J.C.; Foster-Powell, K.; Buyken, A.E.; Goletzke, J. International Tables of Glycemic Index and Glycemic Load Values 2021: A Systematic Review. Am. J. Clin. Nutr. 2021, 31, 2281–2283. [Google Scholar] [CrossRef]
- Augustin, L.S.A.; Kendall, C.W.C.; Jenkins, D.J.A.; Willett, W.C.; Astrup, A. Nutrition, Metabolism & Cardiovascular Diseases Glycemic Index, Glycemic Load and Glycemic Response: An International Scientific Consensus Summit From the International Carbohydrate Quality Consortium (ICQC). Nutr. Metab. Cardiovasc. Dis. 2015, 25, 795–815. [Google Scholar] [CrossRef] [Green Version]
- Cox, D.J.; Fang, K.; Mccall, A.L.; Conaway, M.R.; Banton, T.A.; Moncrief, M.A.; Diamond, A.M.; Taylor, A.G. Behavioral Strategies to Lower Postprandial Glucose in Those with Type 2 Diabetes May Also Lower Risk of Coronary Heart Disease. Diabetes Ther. 2019, 10, 277–281. [Google Scholar] [CrossRef] [Green Version]
- Sieri, S.; Agnoli, C.; Pala, V.; Grioni, S.; Brighenti, F.; Pellegrini, N.; Masala, G.; Palli, D.; Mattiello, A.; Panico, S.; et al. Dietary Glycemic Index, Glycemic Load, and Cancer Risk: Results From the Epic-Italy Study. Sci. Rep. 2017, 7, 9757. [Google Scholar] [CrossRef] [Green Version]
- Mirrahimi, A.; De Souza, R.J.; Chiavaroli, L.; Sievenpiper, J.L.; Beyene, J.; Hanley, A.J.; Augustin, L.S.A.; Kendall, C.W.C.; Jenkins, D.J.A. Associations of Glycemic Index and Load with Coronary Heart Disease Events: A Systematic Review and Meta-Analysis of Prospective Cohorts. J. Am. Heart Assoc. 2012, 1, e000752. [Google Scholar] [CrossRef] [Green Version]
- Wolever, T.M.; Jenkins, D.J.; Jenkins, A.L.; Josse, R.G. the Glycemic Index: Methodology and Clinical Implications. Am. J. Clin. Nutr. 1991, 54, 846–854. [Google Scholar] [CrossRef]
- Arnett, D.K.; Blumenthal, R.S.; Albert, M.A.; Buroker, A.B.; Goldberger, Z.D.; Hahn, E.J.; Himmelfarb, C.D.; Khera, A.; Lloyd-Jones, D.; Mcevoy, J.W.; et al. 2019 Acc/Aha Guideline on the Primary Prevention of Cardiovascular Disease: Executive Summary: A Report of the American College of Cardiology/American Heart Association Task Force on Clinical Practice Guidelines. Circulation 2019, 140, E563–E595. [Google Scholar] [CrossRef]
- Piepoli, M.F.; Hoes, A.W.; Agewall, S.; Albus, C.; Brotons, C.; Catapano, A.L.; Cooney, M.T.; Corrà, U.; Cosyns, B.; Deaton, C.; et al. 2016 European Guidelines on Cardiovascular Disease Prevention in Clinical Practice. Eur. Heart J. 2016, 37, 2315–2381. [Google Scholar] [CrossRef]
- Davies, M.J.; D’alessio, D.A.; Fradkin, J.; Kernan, W.N.; Mathieu, C.; Mingrone, G.; Rossing, P.; Tsapas, A.; Wexler, D.J.; Buse, J.B. Management of Hyperglycemia in Type 2 Diabetes, 2018. A Consensus Report By the American Diabetes Association (ADA) and the European Association for the Study of Diabetes (EASD). Diabetes Care 2018, 41, 2669–2701. [Google Scholar] [CrossRef] [Green Version]
- Evert, A.B.; Boucher, J.L.; Cypress, M.; Dunbar, S.A.; Franz, M.J.; Mayer-Davis, E.J.; Neumiller, J.J.; Nwankwo, R.; Verdi, C.L.; Urbanski, P.; et al. Nutrition therapy Recommendations for the Management of Adults with Diabetes. Diabetes Care 2014, 37, S120–S143. [Google Scholar] [CrossRef] [Green Version]
- Sievenpiper, J.L.; Chan, C.B.; Dworatzek, P.D.; Med, C.F.; Williams Med, S.L. 2018 Clinical Practice Guidelines Nutrition therapy Diabetes Canada Clinical Practice Guidelines Expert Committee. Can. J Diabetes 2018, 42, S64–S79. [Google Scholar] [CrossRef]
- Huang, M.; Li, J.; Ha, M.A.; Riccardi, G.; Liu, S. A Systematic Review on the Relations between Pasta Consumption and Cardio-Metabolic Risk Factors. Nutr. Metab. Cardiovasc. Dis. 2017, 27, 939–948. [Google Scholar] [CrossRef] [Green Version]
- Kristensen, M.; Jensen, M.G.; Riboldi, G.; Petronio, M.; Bügel, S.; Toubro, S.; Tetens, I.; Astrup, A. Wholegrain Vs. Refined Wheat Bread and Pasta. Effect on Postprandial Glycemia, Appetite, and Subsequent Ad Libitum Energy Intake in Young Healthy Adults. Appetite 2010, 54, 163–169. [Google Scholar] [CrossRef]
- Riccardi, G.; Clemente, G.; Giacco, R. Glycemic Index of Local Foods and Diets: The Mediterranean Experience. Nutr. Rev. 2003, 61, 56–60. [Google Scholar] [CrossRef] [PubMed]
- Anderson, J.W.; Baird, P.; Davis, R.H.; Ferreri, S.; Knudtson, M.; Koraym, A.; Waters, V.; Williams, C.L. Health Benefits of Dietary Fiber. Nutr. Rev. 2009, 67, 188–205. [Google Scholar] [CrossRef] [PubMed]
- Bahado-Singh, P.S.; Wheatley, A.O.; Ahmad, M.H.; St A Morrison, E.Y.; Asemota, H.N. Food Processing Methods Influence the Glycaemic Indices of Some Commonly Eaten West Indian Carbohydrate-Rich Foods. Br. J. Nutr. 2020, 96, 476–481. [Google Scholar] [CrossRef]
- Betoret, E.; Betoret, N.; Vidal, D.; Fito, P. Functional Foods Development: Trends and Technologies. Trends Food Sci. Technol. 2011, 22, 498–508. [Google Scholar] [CrossRef]
- Fogliano, V.; Vitaglione, P. Functional Foods: Planning and Development. Mol. Nutr. Food Res. 2005, 49, 256–262. [Google Scholar] [CrossRef] [PubMed]
- Foschia, M.; Horstmann, S.W.; Arendt, E.K.; Zannini, E. Legumes as Functional Ingredients in Gluten-Free Bakery and Pasta Products. Annu. Rev. Food Sci. Technol. 2017, 8, 75–96. [Google Scholar] [CrossRef]
- Bustos, M.C.; Pérez, G.T.; León, A.E. Effect of Four Types of Dietary Fiber on the Technological Quality of Pasta. Food Sci. Technol. Int. 2011, 17, 213–221. [Google Scholar] [CrossRef]
- Bustos, M.C.; Perez, G.T.; Leon, A.E. Structure and Quality of Pasta Enriched with Functional Ingredients. Rsc Adv. 2015, 5, 30780–30792. [Google Scholar] [CrossRef]
- Bustos, M.C.; Paesani, C.; Quiroga, F.; León, A.E. Technological and Sensorial Quality of Berry-Enriched Pasta. Cereal Chem. 2019, 96, 967–976. [Google Scholar] [CrossRef]
- Zen, C.K.; Tiepo, C.B.V.; Silva, R.V.; Reinehr, C.O.; Gutkoski, L.C.; Oro, T.; Colla, L.M. Development of Functional Pasta with Microencapsulated Spirulina: Technological and Sensorial Effects. J. Sci. Food Agric. 2020, 100, 2018–2026. [Google Scholar] [CrossRef] [PubMed]
- Biernacka, B.; Dziki, D.; Gawlik-Dziki, U.; Różyło, R.; Siastała, M. Physical, Sensorial, and Antioxidant Properties of Common Wheat Pasta Enriched with Carob Fiber. LWT-Food Sci. Technol. 2017, 77, 186–192. [Google Scholar] [CrossRef]
- El-Sohaimy, S.; Brennan, M.; Darwish, A.M.G.; Brennan, C. Physicochemical, Texture and Sensorial Evaluation of Pasta Enriched with Chickpea Flour and Protein Isolate. Ann. Agric. Sci. 2020, 65, 28–34. [Google Scholar] [CrossRef]
- Fois, S.; Campus, M.; Piu, P.P.; Siliani, S.; Sanna, M.; Roggio, T.; Catzeddu, P. Fresh Pasta Manufactured with Fermented Whole Wheat Semolina: Physicochemical, Sensorial, and Nutritional Properties. Foods 2019, 8, 422. [Google Scholar] [CrossRef] [PubMed] [Green Version]
- Giménez, M.A.; González, R.J.; Wagner, J.; Torres, R.; Lobo, M.O.; Samman, N.C. Effect of Extrusion Conditions on Physicochemical and Sensorial Properties of Corn-Broad Beans (Vicia Faba) Spaghetti Type Pasta. Food Chem. 2013, 136, 538–545. [Google Scholar] [CrossRef] [PubMed]
- Panghal, A.; Kaur, R.; Janghu, S.; Sharma, P.P.; Sharma, P.P.; Chhikara, N. Nutritional, Phytochemical, Functional and Sensorial Attributes of Syzygium Cumini L. Pulp Incorporated Pasta. Food Chem. 2019, 289, 723–728. [Google Scholar] [CrossRef]
- Regolamento (Ce), N. 1924/2006 Del Parlamento Europeo E Del Consiglio Del 20 Dicembre 2006 Relativo Alle Indicazioni Nutrizionali E Sulla Salute Fornite Sui Prodotti Alimentari. Available online: https://Eur-Lex.Europa.Eu/Legal-Content/It/Txt/Pdf/?Uri=Celex:32006r1924&From=It (accessed on 25 April 2021).
- Aschemann-Witzel, J.; Hamm, U. Do Consumers Prefer Foods with Nutrition and Health Claims? Results of a Purchase Simulation. J. Mark. Commun. 2010, 16, 47–58. [Google Scholar] [CrossRef]
- Lemken, D.; Knigge, M.; Meyerding, S.; Spiller, A. the Value of Environmental and Health Claims on New Legume Products: A Non-Hypothetical online Auction. Sustainability 2017, 9, 1340. [Google Scholar] [CrossRef] [Green Version]
- Sogari, G.; Li, J.; Lefebvre, M.; Menozzi, D.; Pellegrini, N.; Cirelli, M.; Gómez, M.I.; Mora, C. The Influence of Health Messages in Nudging Consumption of Whole Grain Pasta. Nutrients 2019, 11, 2993. [Google Scholar] [CrossRef] [PubMed] [Green Version]
- Van Trijp, H.C.M.; Van Der Lans, I.A. Consumer Perceptions of Nutrition and Health Claims. Appetite 2007, 48, 305–324. [Google Scholar] [CrossRef] [PubMed]
- Pelletier, X.; Thouvenot, P.; Belbraouet, S.; Chayvialle, J.A.; Hanesse, B.; Mayeux, D.; Debry, G. Effect of Egg Consumption in Healthy Volunteers: Influence of Yolk, White or Whole-Egg on Gastric Emptying and on Glycemic and Hormonal Responses. Ann. Nutr. Metab. 1996, 40, 109–115. [Google Scholar] [CrossRef]
- Singh, M.; Manickavasagan, A.; Shobana, S.; Mohan, V. Glycemic Index of Pulses and Pulse-Based Products: A Review. Crit. Rev. Food Sci. Nutr. 2020, 61, 1567–1588. [Google Scholar] [CrossRef]
- Trinidad, T.P.; Mallillin, A.C.; Loyola, A.S.; Sagum, R.S.; Encabo, R.R. The Potential Health Benefits of Legumes as a Good Source of Dietary Fibre. Br. J. Nutr. 2010, 103, 569–574. [Google Scholar] [CrossRef] [Green Version]
- Venn, B.J.; Mann, J.I. Cereal Grains, Legumes and Diabetes. Eur. J. Clin. Nutr. 2004, 58, 1443–1461. [Google Scholar] [CrossRef] [Green Version]
- Ludwig, D.S. Dietary Glycemic Index and Obesity. J. Nutr. 2000, 130, 280s–283s. [Google Scholar] [CrossRef]
- Parada, J.; Pérez-Correa, J.R.; Pérez-Jiménez, J. Design of Low Glycemic Response Foods Using Polyphenols from Seaweed. J. Funct. Foods 2019, 56, 33–39. [Google Scholar] [CrossRef] [Green Version]
- Belorio, M.; Gómez, M. Psyllium: A Useful Functional Ingredient in Food Systems. Crit. Rev. Food Sci. Nutr. 2020, 21, 1–12. [Google Scholar] [CrossRef] [PubMed]
- Capriles, V.D.; Arêas, J.A.G. Approaches to Reduce the Glycemic Response of Gluten-Free Products: In Vivo and in Vitro Studies. Food Funct. 2016, 7, 1266–1272. [Google Scholar] [CrossRef]
- Dall’asta, M.; Del Rio, D.; Tappy, L.; Potì, F.; Agostoni, C.; Brighenti, F. Critical and Emerging topics in Dietary Carbohydrates and Health. Int. J. Food Sci. Nutr. 2020, 71, 286–295. [Google Scholar] [CrossRef]
- Padalino, L.; Conte, A.; Del Nobile, M. Overview on the General Approaches to Improve Gluten-Free Pasta and Bread. Foods 2016, 5, 87. [Google Scholar] [CrossRef] [PubMed] [Green Version]
- Englyst, K.N.; Vinoy, S.; Englyst, H.N.; Lang, V. Glycaemic Index of Cereal Products Explained By their Content of Rapidly and Slowly Available Glucose. Br. J. Nutr. 2003, 89, 329–339. [Google Scholar] [CrossRef] [PubMed]
- Ross, S.W.; Brand, J.C.; Thorburn, A.W.; Truswell, S. Glycemic Index of Processed Wheat Products. Am. J. Clin. Nutr. 1987, 46, 631–635. [Google Scholar] [CrossRef] [PubMed]
- Vega-López, S.; Ausman, L.M.; Griffith, J.L.; Lichtenstein, A.H. Interindividual Variability and Intra-Individual Reproducibility of Glycemic Index Values for Commercial White Bread. Diabetes Care 2007, 30, 1412–1417. [Google Scholar] [CrossRef] [PubMed] [Green Version]
- Vrolix, R.; Mensink, R.P. Variability of the Glycemic Response to Single Food Products in Healthy Subjects. Contemp. Clin. Trials 2010, 31, 5–11. [Google Scholar] [CrossRef] [PubMed]
- Collier, G.; Mclean, A.; O’dea, K. Effect of Co-Ingestion of Fat on the Metabolic Responses to Slowly and Rapidly Absorbed Carbohydrates. Diabetologia 1984, 26, 50–54. [Google Scholar] [CrossRef] [Green Version]
- Moghaddam, E.; Vogt, J.A.; Wolever, T.M.S. The Effects of Fat and Protein on Glycemic Responses in Nondiabetic Humans Vary with Waist Circumference, Fasting Plasma Insulin, and Dietary Fiber Intake. J. Nutr. 2006, 136, 2506–2511. [Google Scholar] [CrossRef]
- Sun, L.; Tan, K.W.J.; Lim, J.Z.; Magkos, F.; Henry, C.J. Dietary Fat and Carbohydrate Quality Have Independent Effects on Postprandial Glucose and Lipid Responses. Eur. J. Nutr. 2018, 57, 243–250. [Google Scholar] [CrossRef]
Figure 1.
Raw materials commonly employed to produce enriched pasta product at high nutritional value.
Figure 1.
Raw materials commonly employed to produce enriched pasta product at high nutritional value.

Figure 2.
GI values of the 10 categories of pp analyzed. Red diamonds correspond to high GI pp; orange diamonds to medium GI pp; green diamonds to low-GI pp. Values reported in the figure correspond to the mean value for each category. Note: category n 1: 100% refined wheat; category n 2: 100% whole wheat; category n 3: other cereal-based products; category n 4: containing egg; category n 5: gluten free; category n 6: containing legumes; category n 7: noodles and vermicelli; category n 8: containing vegetable or algae; category n 9: containing other ingredients; category n 10: stuffed.


Table 1.
Pasta product characteristics, glycemic index and experimental protocol data.
| Pasta Product Characteristics | GI Data | Experimental Protocol Data | |||||||
|---|---|---|---|---|---|---|---|---|---|
| Types | Formulation | Mean Value | Data Distribution | Blood Sample Type | Sample Size | Standard Meal | Av. CHO (g)/Portion | Place of Analysis | Ref. |
| Category n 1: 100% refined wheat | |||||||||
| Low GI | |||||||||
| -spaghetti, dried at high temperature (80 °C) * | durum wheat (var. Duilio) flour | 32.6 | 6.1 º | capillary | 10 | G | 50.0 | Italy | [36] |
| -spaghetti § | durum wheat flour | 33.0 | 6.0 º | capillary | 10 | G | 50.0 | Italy | [37] |
| -spaghetti * | white wheat flour | 36.4 | 35.8 ** | venous | 12 | G | 50.0 | IS | [38] |
| -spaghetti * | white wheat flour | 42.1 | 10.8 ** | capillary | 10 | G | 50.0 | IS | [38] |
| -spaghetti * | white wheat flour | 43.8 | 9.2 ** | capillary | 10 | G | 50.0 | IS | [38] |
| -spaghetti * | durum wheat flour | 44.0 | 7.0 º | capillary | 13 | G | 50.0 | Italy | [39] |
| -spaghetti * (CT: 15 min) | white flour | 44.0 | 3.0 º | n.a. | 10 | G | 48.0 | Australia | [40] |
| -spaghetti * | white wheat flour | 44.1 | 19.8 ** | capillary | 10 | G | 50.0 | IS | [38] |
| -penne § | durum wheat flour | 47.0 | 4.0 º | capillary | 10 | G | 50.0 | Italy | [37] |
| -spaghetti * | semolina flour | 47.0 | n.a. | capillary | 12 | G | 50.0 | Iran | [41] |
| -spaghetti, dry * | durum wheat (var. Svevo) flour | 48.0 | 4.0 º | n.a. | 10 | G | 50.0 | Italy | [42] |
| -penne § | durum wheat flour | 50.0 | 7.0 º | capillary | 10 | G | 50.0 | Italy | [37] |
| -spaghetti § | durum wheat flour | 50.0 | 9.0 º | capillary | 10 | G | 50.0 | Italy | [37] |
| -spaghetti § | durum wheat flour | 51.0 | 9.0 º | capillary | 10 | G | 50.0 | Italy | [37] |
| -spaghetti, dry * | durum wheat (var. Svevo) flour | 52.0 | 3.0 º | n.a. | 10 | G | 50.0 | Italy | [42] |
| -spaghetti, dry § (CT: 8 min) | durum wheat semolina | 52.0 | 4.0 º | capillary | 10 | G | 50.0 | Italy | [43] |
| -spaghetti, dried at low temperature (55 °C) § (CT:10 min) | durum wheat flour | 52.3 | 7.0 º | capillary | 15 | G | 50.0 | France | [44] |
| -pasta # | durum wheat semolina flour | 52.5 | 8.4 º | capillary | 15 | G | 50.0 | Italy | [21] |
| -short penne § | durum wheat flour | 53.0 | 5.0 º | capillary | 10 | G | 50.0 | Italy | [37] |
| -fusilli, dry # (CT: 10 min) | durum wheat flour | 54.0 | 11.0 º | capillary | 10 | G | 50.0 | UK | [45] |
| -spaghetti # | durum wheat flour | 54.9 | n.a. | n.a. | 10 | WB | 50.0 | Italy | [46] |
| Medium GI | |||||||||
| -spaghetti * (CT: 15 min) | 100% durum wheat semolina | 58.0 | 6.8 º | capillary | 10 | WB | 50.0 | Sweden | [47] |
| -small penne § | durum wheat flour | 59.0 | 11.0 º | capillary | 10 | G | 50.0 | Italy | [37] |
| -spaghetti *, infused | common wheat (var. Nol) flour | 60.0 | n.a. | capillary | 12 | G | 50.0 | Iran | [41] |
| -macaroni * | wheat flour | 61.0 | 5.0 º | n.a. | 10 | WB | 50.0 | Canada | [48] |
| -fusilli * (CT: 10 min) | durum wheat semolina | 61.0 | 9.0 º | n.a. | 10 | G | 50.0 | UK | [49] |
| -white spaghetti * and stored | white wheat flour | 62.0 | 5.0 º | capillary | 10 | WB | 50.0 | Brasile | [50] |
| -spaghetti * and infused | semolina flour | 63.0 | n.a. | capillary | 12 | G | 50.0 | Iran | [41] |
| -white spaghetti and stored * | white wheat flour | 64.0 | 7.0 º | capillary | 10 | WB | 50.0 | Brasile | [50] |
| -spaghetti *, infused | common wheat (var. Nol) flour | 68.0 | n.a. | capillary | 12 | G | 50.0 | Iran | [41] |
| -spaghetti * | white wheat flour | 70.0 | 10.0 º | n.a. | 12 | WB | 44.0 | Australia | [40] |
| High GI | |||||||||
| -pasta * | wheat flour | 72.6 | n.a. | capillary | 10 | WB | n.a. | Indonesia | [18] |
| -spaghetti * | wheat refined flour | 72.8 | 5.0 º | capillary | 12 | G | n.a. | Spain | [19] |
| -pasta, fresh # (CT: 20 min) | semolina flour | 78.0 | 8.0 º | capillary | 10 | WB | 50.0 | Canada | [51] |
| -spaghetti * | white wheat flour | 83.6 | 9.6 º | capillary | 19 | G | 50.0 | Canada | [33] |
| Category n 2: 100% whole wheat | |||||||||
| Low GI | |||||||||
| -spaghetti § | whole-meal durum wheat flour | 35.0 | 3.0 º | capillary | 10 | G | 50.0 | Italy | [37] |
| -short penne § | whole-meal durum wheat flour | 48.0 | 9.0 º | capillary | 10 | G | 50.0 | Italy | [37] |
| -spaghetti § | whole-meal durum wheat flour | 53.0 | 10.0 º | capillary | 10 | G | 50.0 | Italy | [37] |
| -spaghetti § | whole-meal durum wheat flour | 55.0 | 10.0 º | capillary | 10 | G | 50.0 | Italy | [37] |
| -fusilli, dry # (CT: 10 min) | whole wheat flour | 55.0 | 8.0 º | capillary | 10 | G | 50.0 | UK | [45] |
| Medium GI | |||||||||
| -spaghetti * | whole wheat flour | 65.0 | n.a. | n.a. | 10 | WB | 40.0 | Canada | [40] |
| Category n 3: other cereal-based products | |||||||||
| Low GI | |||||||||
| -spaghetti, dried at high temperature (80 °C) * | emmer wheat flour (emmer genotype 399) | 18.1 | 2.6 º | capillary | 10 | G | 50.0 | Italy | [36] |
| -spaghetti, dried at high temperature (80 °C) * | emmer wheat flour (emmer genotype 257) | 30.5 | 4.7 º | capillary | 10 | G | 50.0 | Italy | [36] |
| -spaghetti # | Kamut® (T. polonicum) flour | 41.6 | n.a. | n.a. | 10 | WB | 50.0 | Italy | [46] |
| Medium GI | |||||||||
| -spaghetti # | spelt (T. dicoccum) flour | 56.5 | n.a. | n.a. | 10 | WB | 50.0 | Italy | [46] |
| -pasta fresh # (CT: 5 min) | Celebrity barley cultivar (white pearled) flour | 58.0 | 4.0 º | capillary | 10 | WB | 50.0 | Canada | [51] |
| -pasta fresh # (CT: 5 min) | AC Parkhill barley cultivar (white pearled) flour | 64.0 | 4.0 º | capillary | 10 | WB | 50.0 | Canada | [51] |
| High GI | |||||||||
| -pasta fresh # (CT: 5 min) | Celebrity barley cultivar (whole grain) flour | 71.0 | 6.0 º | capillary | 10 | WB | 50.0 | Canada | [51] |
| -pasta fresh # (CT: 5 min) | AC Parkhill barley cultivar (whole grain) flour | 73.0 | 7.0 º | capillary | 10 | WB | 50.0 | Canada | [51] |
| Category n 4: containing egg | |||||||||
| Low GI | |||||||||
| -fettuccine * | egg pasta | 47.0 | n.a. | venous | 14 | G | 46.0 | NZ | [52] |
| -tagliatelle § | durum wheat flour, eggs | 51.0 | 7.0 º | capillary | 10 | G | 50.0 | Italy | [37] |
| -lasagne, dry # (CT: 10 min) | egg pasta | 53.0 | 9.0 º | capillary | 10 | G | 50.0 | UK | [45] |
| -tagliatelle * | egg pasta | 54.0 | 5.0 º | capillary | 10 | G | 50.0 | UK | [53] |
| -tagliatelle, dry § | durum wheat flour, eggs | 55.0 | 4.0 º | capillary | 10 | G | 50.0 | Italy | [37] |
| Category n 5: gluten free | |||||||||
| Low GI | |||||||||
| -penne, dry § | corn flour, millet flour, sugar cane syrup | 48.1 | n.a. | capillary | 10 | G | 50.0 | Italy | [34] |
| -spaghetti | rice and high amylose maize flour | 51.0 | 5.0 º | n.a. | 10 | G | 49.0 | Australia | [40] |
| -pasta | rice flour | 51.0 | n.a. | n.a. | 10 | G | 47.0 | Australia | [40] |
| -fusilli, dry § | 100% corn flour, water | 54.4 | n.a. | capillary | 10 | G | 50.0 | Italy | [34] |
| Medium GI | |||||||||
| -tagliatelle, fresh § | rice, corn and chickpea flour, eggs (20%), egg white, water | 59.6 | n.a. | capillary | 10 | G | 50.0 | Italy | [34] |
| -tortellini, fresh § | rice, corn and chickpea flour, eggs (20%), egg white, water, stuffed with pork meat | 60.6 | n.a. | capillary | 10 | G | 50.0 | Italy | [34] |
| -pasta macaroni, dry # | parboiled rice flour | 61.0 | n.a. | capillary | 10 | G | 40.0 | Italy | [54] |
| -pasta, macaroni dry # | parboiled rice flour | 65.0 | n.a. | capillary | 10 | G | 40.0 | Italy | [54] |
| -vermicelli * | finger millet flour, defatted soy, resistant maltodextrin | 65.5 | 5.5 º | capillary | 16 | G | 50.0 | India | [55] |
| High GI | |||||||||
| -macaroni, dry # | rice flour | 71.0 | n.a. | capillary | 10 | G | 40.0 | Italy | [54] |
| -pasta * | corn flour | 78.0 | 10.0 º | n.a. | 10 | G | 42.0 | Australia | [40] |
| Category n 6: containing legumes | |||||||||
| Low GI | |||||||||
| -pasta # | 60% grass pea flour, 40% chickpea flour | 20.0 | 7.6 º | capillary | 15 | G | 50.0 | Italy | [21] |
| -pasta # | 100% red lentil flour | 22.3 | 6.9 º | capillary | 15 | G | 50.0 | Italy | [21] |
| -pasta # | 100% pea flour | 23.3 | 6.7 º | capillary | 15 | G | 50.0 | Italy | [21] |
| -spaghetti, dried at low temperature (55 °C) § (CT: 10.5 min) | 35% faba bean flour, durum wheat semolina | 41.9 | 5.7 º | capillary | 15 | G | 50.0 | France | [44] |
| -spaghetti | soy flour | 47.0 | 7.4 º | capillary | 10 | G | 25.0 | Australia | [32] |
| -spaghetti, dried at high temperature (90 °C) § (CT: 13.5 min) | 35% faba bean flour, durum wheat semolina | 49.4 | 6.8 º | capillary | 15 | G | 50.0 | France | [44] |
| -macaroni * | 50% red lentil flour | 55.0 | 8.0 º | n.a. | 10 | WB | 50.0 | Canada | [48] |
| Medium GI | |||||||||
| -spaghetti * (CT: 10 min) | 75% durum wheat flour, 25% chickpea flour | 58.9 | 6.0 º | capillary | 12 | G | n.a. | Spain | [19] |
| High GI | |||||||||
| -spaghetti * | 30% whole yellow pea flour, white durum wheat flour | 93.3 | 9.4 º | capillary | 19 | G | 50.0 | Canada | [33] |
| Category n 7: noodles and vermicelli | |||||||||
| Low GI | |||||||||
| -noodles, dry * | wheat flour | 46.0 | 5.8 º | venous | 10 | G | 50.0 | China | [56] |
| -noodle, dried | wheat | 46.0 | 2.0 º | n.a. | 10 | G | 42.0 | China | [40] |
| -noodles, instant ‘two-minute’ | n.a. | 48.0 | n.a. | venous | 15 | G | 26.0 | NZ | [52] |
| -noodles, instant, all flavors | n.a. | 52.0 | 5.0 º | n.a. | 10 | G | 22.0 | Australia | [40] |
| Medium GI | |||||||||
| -Jianxi vermicelli * (CT: 8 min) | rice flour | 56.0 | 7.0 º | capillary | 10 | G | 50.0 | HK | [57] |
| -Sau tao Beijing noodles * (CT: 3 min) | wheat flour, salt, tapioca starch | 61.0 | 5.0 º | capillary | 10 | G | 50.0 | HK | [57] |
| -noodles, reheated (CT: 5 min) | udon pasta, plain | 62.0 | 8.0 º | n.a. | 10 | G | 48.0 | Australia | [40] |
| -Sau tao chicken-flavored Sichuan spicy noodles * (CT: 3 min) | wheat flour, salt | 65.0 | 4.0 º | capillary | 10 | G | 50.0 | HK | [57] |
| -Taiwan vermicelli * (CT: 2 min) | rice, maize starch | 68.0 | 12.0 º | capillary | 10 | G | 50.0 | HK | [57] |
| Category n 8: containing vegetable or algae | |||||||||
| Low GI | |||||||||
| -small farfalle § | durum wheat flour, carrot and pumpkin pulps | 44.0 | 5.0 º | capillary | 10 | G | 50.0 | Italy | [37] |
| -pasta, dry * | wheat flour, algae (eucheuma cottonii) flour (21%), eggs, cooking oil | 44.4 | n.a. | capillary | 10 | WB | N/A | Indonesia | [18] |
| -small pipe § | durum wheat flour, tomato and carrot pulps | 47.0 | 7.0 º | capillary | 10 | G | 50.0 | Italy | [37] |
| -small penne § | durum wheat flour, zucchini and spinach pulps | 48.0 | 5.0 º | capillary | 10 | G | 50.0 | Italy | [37] |
| Medium GI | |||||||||
| -pasta, dry * | wheat flour, algae (eucheuma cottonii) flour (14%), eggs, cooking oil | 56.3 | n.a. | capillary | 10 | WB | n.a. | Indonesia | [18] |
| -pasta, dry * | wheat flour, algae (eucheuma cottonii) flour (7%), eggs, cooking oil | 66.4 | n.a. | capillary | 10 | WB | n.a. | Indonesia | [18] |
| Category n 9: containing other ingredients | |||||||||
| Low GI | |||||||||
| -pasta * | protein enriched | 28.0 | 1.0 º | n.a. | 10 | G | 49.0 | Australia | [40] |
| -spaghetti, dry § (CT: 8.5 min) | 85% durum wheat semolina, 15% Barley Balance® | 33.0 | 5.0 º | capillary | 10 | G | 50.0 | Italy | [43] |
| -spaghetti, dry § (CT: 8 min) | 85% durum wheat semolina, 7.5% Barley Balance®, 7.5% psyllium seed husk | 35.0 | 3.0 º | capillary | 10 | G | 50.0 | Italy | [43] |
| -spaghetti, dry * | durum wheat (var Svevo, line SBEIIa) flour, 58% amylose, 7.36% RS | 38.0 | 3.0 º | n.a. | 10 | G | 50.0 | Italy | [42] |
| -spaghetti, dry * | durum wheat (var Svevo line SSIIa) flour, 44% amylose, 2.06% RS | 49.0 | 3.0 º | n.a. | 10 | G | 50.0 | Italy | [42] |
| Category n 10: stuffed | |||||||||
| Medium GI | |||||||||
| -ravioli, fresh § | durum wheat flour, stuffed with calf meat | 58.0 | 7.0 º | capillary | 10 | G | 50.0 | Italy | [37] |
GI = glycemic index; º = data distribution is expressed as standard error of mean (SEM); ** = data distribution is expressed as standard deviation (SD); G = glucose solution; WB = white bread; Av. CHO = available carbohydrates; n.a. = not available; UK = United Kingdom; NZ = New Zealand; HK: Hong Kong; IS = interlaboratory study: the study was performed in Canada, Italia, Australia, Sweden, New Zealand, West Indies and South Africa; GF = gluten free; § = boiled in salted water; # = boiled in unsalted water; * = boiled in water; CT = cooking time; RS = resistant starch; Var = variety.
Publisher’s Note: MDPI stays neutral with regard to jurisdictional claims in published maps and institutional affiliations. |
© 2021 by the authors. Licensee MDPI, Basel, Switzerland. This article is an open access article distributed under the terms and conditions of the Creative Commons Attribution (CC BY) license (https://creativecommons.org/licenses/by/4.0/).
Share and Cite
MDPI and ACS Style
Di Pede, G.; Dodi, R.; Scarpa, C.; Brighenti, F.; Dall’Asta, M.; Scazzina, F. Glycemic Index Values of Pasta Products: An Overview. Foods 2021, 10, 2541. https://doi.org/10.3390/foods10112541
AMA Style
Di Pede G, Dodi R, Scarpa C, Brighenti F, Dall’Asta M, Scazzina F. Glycemic Index Values of Pasta Products: An Overview. Foods. 2021; 10(11):2541. https://doi.org/10.3390/foods10112541
Chicago/Turabian StyleDi Pede, Giuseppe, Rossella Dodi, Cecilia Scarpa, Furio Brighenti, Margherita Dall’Asta, and Francesca Scazzina. 2021. "Glycemic Index Values of Pasta Products: An Overview" Foods 10, no. 11: 2541. https://doi.org/10.3390/foods10112541
Note that from the first issue of 2016, this journal uses article numbers instead of page numbers. See further details here.