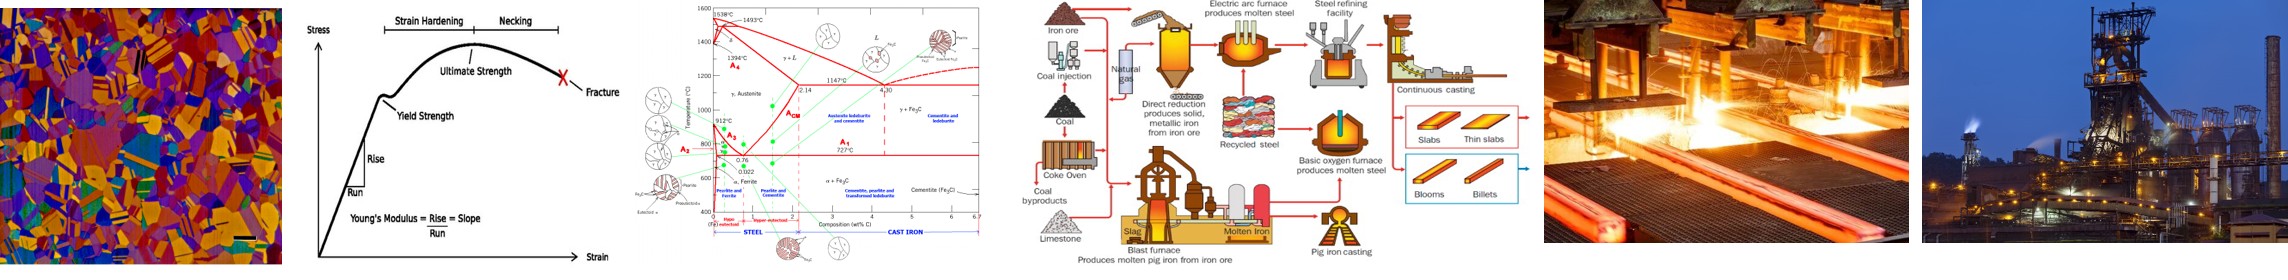
TTT Diagram For Eutectoid Steel T-T-T diagram is also called isothermal transformation diagram [Temperature-Time –Transformation]. It is a plot of temperature versus the logarithm of time for a steel alloy of definite composition. It is used to determine when transformations begin and end for an isothermal [constant thermal] heat treatment of a previously austenitized alloy. At temperatures just below eutectoid temperature, austenite decomposes into pearlite; at lower temperatures (600 deg C) sorbite is formed and at 500 – 550 degree C troostites is formed. If the temperature is lowered from 500 deg C to 220 deg C acicular troostite or bainite is formed. In eutectoid steels, the martensite transformation begins at MS (240 deg C) and ends at MF (50 deg C). #metallurgy #metallurgicalengineering
Time, temperature, transformation
Wow. Impressive diagram
I was teaching this one to my students last week 😊
Between 1400 & 1200 a point is called End of transformation.
Turn to the right lane....
Interessante
Very informative and very impressive !!!!
These T.T.T.curves gives information for cooling rate during H.T.
When one looks at how smooth the transtition between the transformation start curves for P and B is in this steel composition, it is easy to imagine why it took until 1930 for Davenport and Bain to figure there was a different phase at low temperature (ES Davenport, E Bain, NJ Kearny. Transformation of Austenite at Constant Subcritical Temperatures (Chicago Meeting, September, 1930). Transactions AIME - Chicago Meeting 1930. 1930;90:117–54. ) And this phase was hence named, some years later, Bainite!